


Hioki IM9000 Equivalent Circuit Analysis Firmware
Use our chat for personal support. Or contact us via +45 31 33 18 19 or salg@GOmeasure.dk
Simple Circuit Analysis & Detailed Acceptance/Rejection Decision-MakingFirmware Upgrade for the IM3570
Discover the possibilities
More information
Description
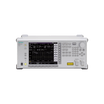
Hioki IM9000 Equivalent Circuit Analysis Firmware
Hioki LCR Meters and Impedance Analyzers range from 1mHz to 3GHz devices to suit a wide range of applications in the testing of electronic components. The IM9000 is a optional firmware upgrade for Model IM3570 to facilitate Cole-Cole plots, simple circuit analysis and detailed acceptance/rejection decisions, adding value to the IM3570 to serve more advanced component analysis.
Key Features
• Automatically select the equivalent circuit model from the five typical models to minimize the differences between the measured values and the ideal frequency characteristics derived from the analysis results
• Determine acceptance/rejection for the L, C, and R elements comprising a part and the resonance sharpness (mechanical quality coefficient)
• Make detailed decisions on the elements using the resonance of a piezoelectric element or inductor
| Three-element model | Equivalent circuit model: Four models for Coil, Resistance, CapacitorMeasurement items: L1 (Inductance), C1 (Capacitance), R1 (Resistance), Qm (Resonance sharpness),fr (Resonance frequency) / fa (Anti-resonance frequency) |
|---|---|
| Four-element model | Equivalent crcuit model: One model for Pizoelectric elementMeasurement items: L1 (Inductance), C1 (Capacitance), R1 (Resistance), C0 (Parallel capacitance), Qm (Resonance sharpness or mechanical quality coefficient)fr (Resonance frequency), fa (Anti-resonance frequency), fs (Series resonance frequency), fp (Parallel resonance frequency), fm (Maximum admittance frequency), fn (Minimum admittance frequency), f1 (Maximum susceptance frequency), f2 (Minimum susceptance frequency) |
| Other functions | Simulation: Enables displaying and comparing the ideal frequency characteristics graph derived from the analysis results or the values specified by the userComparator: Runs a comparator on the analysis results and outputs the decision results to screen, EXT. I/O |
| X-Y display | Cole-Cole plot, Admittance circle display |
Documents
Hioki IM9000
Hioki IM9000 datasheetOptions
Video
Hioki IM9000 Equivalent Circuit Analysis Firmware
Hioki LCR Meters and Impedance Analyzers range from 1mHz to 3GHz devices to suit a wide range of applications in the testing of electronic components. The IM9000 is a optional firmware upgrade for Model IM3570 to facilitate Cole-Cole plots, simple circuit analysis and detailed acceptance/rejection decisions, adding value to the IM3570 to serve more advanced component analysis.
Key Features
• Automatically select the equivalent circuit model from the five typical models to minimize the differences between the measured values and the ideal frequency characteristics derived from the analysis results
• Determine acceptance/rejection for the L, C, and R elements comprising a part and the resonance sharpness (mechanical quality coefficient)
• Make detailed decisions on the elements using the resonance of a piezoelectric element or inductor
| Three-element model | Equivalent circuit model: Four models for Coil, Resistance, CapacitorMeasurement items: L1 (Inductance), C1 (Capacitance), R1 (Resistance), Qm (Resonance sharpness),fr (Resonance frequency) / fa (Anti-resonance frequency) |
|---|---|
| Four-element model | Equivalent crcuit model: One model for Pizoelectric elementMeasurement items: L1 (Inductance), C1 (Capacitance), R1 (Resistance), C0 (Parallel capacitance), Qm (Resonance sharpness or mechanical quality coefficient)fr (Resonance frequency), fa (Anti-resonance frequency), fs (Series resonance frequency), fp (Parallel resonance frequency), fm (Maximum admittance frequency), fn (Minimum admittance frequency), f1 (Maximum susceptance frequency), f2 (Minimum susceptance frequency) |
| Other functions | Simulation: Enables displaying and comparing the ideal frequency characteristics graph derived from the analysis results or the values specified by the userComparator: Runs a comparator on the analysis results and outputs the decision results to screen, EXT. I/O |
| X-Y display | Cole-Cole plot, Admittance circle display |