

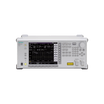
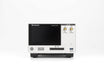


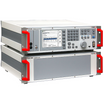


Tektronix RSA5106B 6.2 GHz Real-time Analyzer
Use our chat for personal support. Or contact us via +45 31 33 18 19 or salg@GOmeasure.dk
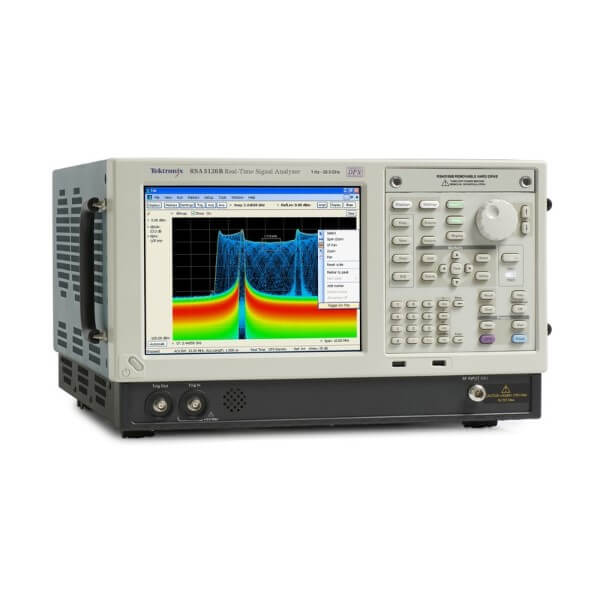
Real Time Signal Analyzer, 1 Hz to 6.2 GHz
Reduce Time-to-Fault and increase design confidence with Real-time Signal Processing:
- Up to 3,125,000 spectrums per second, enables 100% probability of intercept for signals of 0.434 μs
- Swept DPX spectrum enables unprecedented signal discovery over full frequency range
- Advanced DPX including swept DPX, gap-free DPX spectrograms, and DPX zero span with real-time amplitude, frequency, or phase
Discover the possibilities
More information
Description
Tektronix RSA5106B 6.2 GHz Real-time Analyzer
The RSA5106B Real Time Signal Analyzers replace conventional instruments, offering the measurement confidence and functionality you demand for everyday tasks. The RSA5106B offers industry-leading real time specifications and includes best minimum signal duration for 100% probability of intercept and best real time dynamic range. With the RSA5106B, you get the functionality of a high-performance spectrum analyzer, wideband vector signal analyzer, and the unique trigger-capture-analyze capability of a real-time spectrum analyzer – all in a single package.Key performance specifications
- +17 dBm 3rd order intercept at 2 GHz
- ±0.3 dB absolute amplitude accuracy to 3 GHz
- Displayed average noise level: –142 dBm/Hz at 26.5 GHz, –157 dBm/Hz at 2 GHz and –150 dBm/Hz at 10 kHz
- Internal Preamp available: DANL of -156 dBm/Hz at 26.5 GHz, -167 dBm/Hz at 2 GHz
- Phase noise: –113 dBc/Hz at 1 GHz and –134 dBc/Hz at 10 MHz carrier frequency, 10 kHz offset
- High-speed sweeps with high resolution and low noise: 1 GHz sweeps at 10 kHz RBW in <1 second
- Real time spurious free dynamic range of 80 dB with HD options
Key features
- Reduce Time-to-Fault and increase design confidence with Real-time Signal Processing
- Up to 3,125,000 spectrums per second, enables 100% probability of intercept for signals of 0.434 μs
- Swept DPX spectrum enables unprecedented signal discovery over full frequency range
- Advanced DPX including swept DPX, gap-free DPX spectrograms, and DPX zero span with real-time amplitude, frequency, or phase
- Triggers zero in on the Problem
- DPX density™ trigger on single occurrences as brief as 0.434 μs in frequency domain and distinguish between continuous signals vs infrequent events
- Advanced time-qualified, runt, and frequency-edge triggers act on complex signals as brief as 20 ns
- Capture the widest and deepest signals
- 25, 40, 85, 125, or 165 MHz acquisition bandwidths
- Spurious-free dynamic range of 80 dB over the entire acquisition bandwidth with HD options
- Acquire more than 5 seconds at 165 MHz bandwidth
- Wideband preselection filter provides image free measurements in entire analysis bandwidth up to 165 MHz
- More standard analysis than you expect in an everyday tool
- Measurements including channel power, ACLR, CCDF, OBW/EBW, spur search, EMI detectors
- Amplitude, frequency, phase vs. time, DPX spectrum, and spectrograms
- Correlated multi-domain displays
- Performance options for best real time and dynamic range and analysis options offer added value
- High dynamic range options offer unmatched 80 dBc spurious-free analysis in the widest acquisition bandwidth
- High performance DPX offers industry-leading minumum signal duration for 100% probability of intercept
- Optional software applications to add dedicated measurements for specific applications and standards
- AM/FM/PM modulation and audio measurements (Opt. 10)
- Phase noise and jitter (Opt. 11)
- Automated settling time measurements (frequency and phase) (Opt. 12)
- More than 30 pulse measurements, acquisition of more than 200,000 pulses possible for post analysis and cumulative statistics. (Opt. 20)
- General purpose modulation analysis of more than 20 modulation types (Opt. 21)
- Simple and complete APCO Project 25 transmitter compliance testing and analysis for Phase 1 (C4FM) and Phase 2 (TDMA) (Opt. 26)
- WLAN analysis for 802.11 a/b/g/j/p, 802.11n, and 802.11ac (Opts. 23, 24, 25)
- Noise figure and gain measurements (Opt. 14)
- Bluetooth® Analysis (Opt. 27)
- Manual and automatic measurement mapping plus signal strength function provides audio tone and visual indication of received signal strength (Opt. MAP)
- LTE™ FDD and TDD Base Station (eNB) Transmitter RF measurements (Opt. 28)
- Signal Classification and Survey
Applications
- Wideband radar and pulsed RF signals
- Frequency agile communications
- Broadband satellite and microwave backhaul links
- Education
- Long Term Evolution (LTE), Cellular
High performance spectrum and vector signal analysis, and much more
The RSA5106B replaces conventional high-performance signal analyzers, offering the measurement confidence and functionality you demand for everyday tasks. A +17 dBm TOI and -157 dBm/Hz DANL at 2 GHz gives you the dynamic range you expect for challenging spectrum analysis measurements. All analysis is fully preselected and image free. You never have to compromise between dynamic range and analysis bandwidth by 'switching out the preselector'.A complete toolset of power and signal statistics measurements are standard, including Channel Power, ACLR, CCDF, Occupied Bandwidth, AM/FM/PM, and Spurious measurements. Available Phase Noise and General Purpose Modulation Analysis measurements round out the expected set of high-performance analysis tools.
But, just being an excellent mid-range signal analyzer is not sufficient to meet the demands of today's hopping, transient signals.
The RSA5106B will help you to easily discover design issues that other signal analyzers may miss. The revolutionary DPX®spectrum display offers an intuitive live color view of signal transients changing over time in the frequency domain, giving you immediate confidence in the stability of your design, or instantly displaying a fault when it occurs. Once a problem is discovered with DPX®, the RSA5000 Series spectrum analyzers can be set to trigger on the event, capture a contiguous time record of changing RF events, and perform time-correlated analysis in all domains. You get the functionality of a high-performance spectrum analyzer, wideband vector signal analyzer, and the unique trigger-capture-analyze capability of a real-time spectrum analyzer - all in a single package.

Revolutionary DPX ® spectrum display reveals transient signal behavior that helps you discover instability, glitches, and interference. Here, three distinct signals can be seen. Two high-level signals of different frequency-of-occurrence are seen in light and dark blue, and a third signal beneath the center signal can also be discerned. The DPX Density™ trigger allows the user to acquire signals for analysis only when this third signal is present. Trigger On This™ has been activated, and a density measurement box is automatically opened, measuring a signal density 7.275%. Any signal density greater than the measured value will cause a trigger event.
Discover
The patented DPX®spectrum processing engine brings live analysis of transient events to spectrum analyzers. Performing up to 3,125,000 frequency transforms per second, transients of a minimum event duration of 0.434 μs in length are displayed in the frequency domain. This is orders of magnitude faster than swept analysis techniques. Events can be color coded by rate of occurrence onto a bitmapped display, providing unparalleled insight into transient signal behavior. The DPX spectrum processor can be swept over the entire frequency range of the instrument, enabling broadband transient capture previously unavailable in any spectrum analyzer. In applications that require only spectral information, DPX provides gap-free spectral recording, replay, and analysis of up to 60,000 spectral traces. Spectrum recording resolution is variable from 125 µs to 6400 s per line.Trigger
Tektronix has a long history of innovative triggering capability, and the RSA Series spectrum analyzers lead the industry in triggered signal analysis. The RSA5000 Series provides unique triggers essential for troubleshooting modern digitally implemented RF systems, including time-qualified power, runt, density, frequency, and frequency mask triggers.Time qualification can be applied to any internal trigger source, enabling capture of 'the short pulse' or 'the long pulse' in a pulse train, or, when applied to the Frequency Mask Trigger, only triggering when a frequency domain event lasts for a specified time. Runt triggers capture troublesome infrequent pulses that either turn on or turn off to an incorrect level, greatly reducing time to fault.
DPX Density™ Trigger works on the measured frequency of occurrence or density of the DPX display. The unique Trigger On This™ function allows the user to simply point at the signal of interest on the DPX display, and a trigger level is automatically set to trigger slightly below the measured density level. You can capture low-level signals in the presence of high-level signals at the click of a button.
The Frequency Mask Trigger (FMT) is easily configured to monitor all changes in frequency occupancy within the acquisition bandwidth.
A Power Trigger working in the time domain can be armed to monitor for a user-set power threshold. Resolution bandwidths may be used with the power trigger for band limiting and noise reduction. Two external triggers are available for synchronization to test system events.

Trigger and Capture: The DPX Density™ Trigger monitors for changes in the frequency domain, and captures any violations into memory. The spectrogram display (left panel) shows frequency and amplitude changing over time. By selecting the point in time in the spectrogram where the spectrum violation triggered the DPX Density™ Trigger, the frequency domain view (right panel) automatically updates to show the detailed spectrum view at that precise moment in time.
Capture
Real-time capture of small signals in the presence of large signals is enabled with greater than 70 dB SFDR in all acquisition bandwidths, even up to 165 MHz (Opt. B16x). The dynamic range of the wideband acquisition system can be improved to an unmatched 80 dB with the B85HD, B125HD, and B16xHD options. Capture once - make multiple measurements without recapturing. All signals in an acquisition bandwidth are recorded into the RSA5000 Series deep memory. Record lengths vary depending upon the selected acquisition bandwidth - up to 5.36 seconds at 165 MHz, 343.5 seconds at 1 MHz, or 6.1 hours at 10 kHz bandwidth with Memory Extension (Opt. 53). Acquisitions of up to 2 GB in length can be stored in MATLAB™ Level 5 format for offline analysis.Most spectrum analyzers use narrowband tunable band pass filters, often YIG tuned filters (YTF) to serve as a preselector. These filters provide image rejection and improve spurious performance in swept applications by limiting the number of signals present at the first mixing stage. YTF's are narrow band devices by nature and are usually limited to bandwidths less than 50 MHz. These analyzers bypass the input filter when performing wideband analysis, leaving them susceptible to image responses when operating in modes where wideband analysis is required such as for real time signal analysis.
Unlike spectrum analyzers with YTF's, Tektronix Real Time Signal Analyzers use a wideband image-free architecture guaranteeing that signals at frequencies outside of the band to which the instrument is tuned don't create spurious or image responses. This image-free response is achieved with a series of input filters designed such that all image responses are suppressed. The input filters are overlapped by greater than the widest acquisition bandwidth, ensuring that full-bandwidth acquisitions are always available. This series of filters serves the purpose of the preselector used by other spectrum analyzers, but has the benefit of always being on while still providing the image-free response in all instrument bandwidth settings and at all frequencies.
Analyze
The RSA5106B offers analysis capabilities that advance productivity for engineers working on components or in RF system design, integration, and performance verification, or operations engineers working in networks, or spectrum management. In addition to spectrum analysis, spectrograms display both frequency and amplitude changes over time. Time-correlated measurements can be made across the frequency, phase, amplitude, and modulation domains. This is ideal for signal analysis that includes frequency hopping, pulse characteristics, modulation switching, settling time, bandwidth changes, and intermittent signals.The measurement capabilities of the RSA5106B and available options and software packages are summarized in the following section.
Measurement functions
| Standard measurements | Description |
|---|---|
| Spectrum analyzer measurements | Channel power, Adjacent channel power, Multicarrier adjacent channel power/leakage ratio, Spectrum emissions mask, Occupied bandwidth, xdB down, dBm/Hz marker, dBc/Hz marker |
| Real time measurements | DPX Spectrum with density measurements, DPX Spectrogram with spectrums vs. time, Zero-Span DPX with up to 50,000 updates/sec |
| Time domain and statistical measurements | RF IQ vs Time, Power vs Time, Frequency vs Time, Phase vs Time, CCDF, Peak-to-Average Ratio |
| Spur search measurement | Up to 20 frequency ranges, user-selected detectors (Peak, Average, QP), filters (RBW, CISPR, MIL), and VBW in each range. Linear or log frequency scale. Measurements and violations in absolute power or relative to a carrier. Up to 999 violations identified in tabular form for export in .CSV format |
| Analog modulation analysis measurement functions | % amplitude modulation (+, -, total) frequency modulation (±Peak, +Peak, -Peak, RMS, Peak-Peak/2, frequency error) phase modulation (±Peak, RMS, +Peak, -Peak) |
| DPX density measurement | Measures % signal density at any location on the DPX spectrum display and triggers on specified signal density |
| Measurement options | Description |
|---|---|
| AM/FM/PM modulation and audio measurements (Opt. 10) | carrier power, frequency error, modulation frequency, modulation parameters (±Peak, Peak-Peak/2, RMS), SINAD, modulation distortion, S/N, THD, TNHD |
| Phase noise and jitter measurements (Opt. 11) | 10 Hz to 1 GHz frequency offset range, log frequency scale traces - 2: ±Peak trace, average trace, trace smoothing, and averaging |
| Settling Time (Frequency and Phase) (Opt. 12) | Measured frequency, Settling time from last settled frequency, Settling time from last settled phase, Settling time from trigger. Automatic or manual reference frequency selection. User-adjustable measurement bandwidth, averaging, and smoothing. Pass/Fail mask testing with 3 user-settable zones |
| Noise Figure and Gain measurements (Opt. 14) | Measurement displays of noise figure, gain, Y-factor, noise temperature, and tabular results. Single-frequency metering and swept-trace results are available. Support for industry-standard noise sources. Measures amplifiers and other non-frequency converting devices plus fixed local-oscillator up and down converters. Performs mask testing to user-defined limits. Built in uncertainty calculator. |
| Advanced pulse measurements suite (Opt. 20) | Pulse-Ogram™ waterfall display of multiple segmented captures, with amplitude vs time and spectrum of each pulse. Pulse frequency, Delta Frequency, Average on power, Peak power, Average transmitted power, Pulse width, Rise time, Fall time, Repetition interval (seconds), Repetition interval (Hz), Duty factor (%), Duty factor (ratio), Ripple (dB), Ripple (%), Droop (dB), Droop (%), Overshoot (dB), Overshoot (%), Pulse- Ref Pulse frequency difference, Pulse- Ref Pulse phase difference, Pulse- Pulse frequency difference, Pulse- Pulse phase difference, RMS frequency error, Max frequency error, RMS phase error, Max phase error, Frequency deviation, Phase deviation, Impulse response (dB), Impulse response (time), Time stamp. |
| General Purpose Digital Modulation Analysis (Opt. 21) | Error vector magnitude (EVM) (RMS, Peak, EVM vs time), Modulation error ratio (MER), Magnitude error (RMS, Peak, Mag error vs time), Phase error (RMS, Peak, Phase error vs time), Origin offset, Frequency error, Gain imbalance, Quadrature error, Rho, Constellation, Symbol table |
| Flexible OFDM Analysis (Opt. 22) | OFDM analysis for WLAN 802.11a/j/g and WiMAX 802.16-2004 |
| WLAN 802.11a/b/g/j/p measurement application (Opt. 23) | All of the RF transmitter measurements as defined in the IEEE standard, as well as a wide range of additional measurements including Carrier Frequency error, Symbol Timing error, Average/peak burst power, IQ Origin Offset, RMS/Peak EVM, and analysis displays, such as EVM and Phase/Magnitude Error vs. time/frequency or vs. symbols/ subcarriers, as well as packet header decoded information and symbol table.Option 24 requires option 23.Option 25 requires option 24. |
| WLAN 802.11n measurement application (Opt. 24) | |
| WLAN 802.11ac measurement application (Opt. 25) | |
| APCO P25 compliance testing and analysis application (Opt. 26) | Complete set of push-button TIA-102 standard-based transmitter measurements with pass/fail results including ACPR, transmitter power and encoder attack times, transmitter throughput delay, frequency deviation, modulation fidelity, symbol rate accuracy, and transient frequency behavior, as well as HCPM transmitter logical channel peak ACPR, off slot power, power envelope and time alignment. |
| Bluetooth Basic LE TX SIG measurements (Opt. 27) | Presets for transmitter measurements defined by Bluetooth SIG for Basic Rate and Bluetooth Low Energy. Results also include Pass/Fail information. Application also provides packet header field decoding and can automatically detect the standard, including Enhanced Data Rate. |
| LTE Downlink RF measurements (Opt. 28) | Presets for Cell ID, ACLR, SEM, Channel Power and TDD Toff Power. Supports TDD and FDD frame format and all base stations defined by 3GPP TS version 12.5. Results include Pass/Fail information. Real-Time settings make the ACLR and the SEM measurements fast, if the connected instrument has enough bandwidth. |
| Mapping and signal strength (Opt. MAP) | Both manual and automatic drive test are supported by built-in mapping software. Commercial off-the-shelf 3rd party GPS receiver supported via USB or Bluetooth® connection. Supports MapInfo format and scanned version maps. Also supports exporting to popular Google Earth and MapInfo map format for post analysis. Signal strength measurement provides both a visual indicator and audible tone of signal strength. |
| RSAVu Analysis Software | W-CDMA, HSUPA. HSDPA, GSM/EDGE, CDMA2000 1x, CDMA2000 1xEV-DO, RFID, Phase noise, Jitter, IEEE 802.11 a/b/g/n WLAN, IEEE 802.15.4 OQPSK (Zigbee), Audio analysis |
| Signal Classification | The signal classification application enables expert systems guidance to aid the user in classifying signals. It provides graphical tools that allow you to quickly create a spectral region of interest, enabling you to classify and sort signals efficiently. |

Swept DPX can capture low-probability events across spans greater than the real time bandwidth. Here, a 1 GHz sweep views the activity form 1.9 GHz to 2.9 GHz from an off-air antenna. Number signals in the 1.9 GHz cell band are seen, and significant activity in the 2.4 GHz ISM band is apparent. The density measurement both has been used on the largest signal near the center, displaying approximately 3.5% occupancy.

In this illustration, a single region has been selected. Since we have declared this to be an 802.11g signal, the spectrum mask for the 802.11g signal is shown overlaid in the region. The signal is a close match to the spectrum mask, However we can see some interferences with some likely Bluetooth signals in the ISM band

Time-correlated views in multiple domains provide a new level of insight into design problems not possible with conventional analyzers. Here, modulation quality and the constellation measurements are combined with the continuous monitoring of the DPX ® spectrum display.

Spurious Search - Up to 20 noncontiguous frequency regions can be defined, each with their own resolution bandwidth, video bandwidth, detector (peak, average, quasi-peak), and limit ranges. Test results can be exported in .CSV format to external programs, with up to 999 violations reported. Spectrum results are available in linear or log scale.

Audio monitoring and modulation measurements simultaneously can make spectrum management an easier, faster task. Here, the DPX spectrum display shows a live spectrum of the signal of interest and simultaneously provides demodulated audio to the internal instrument loudspeaker. FM deviation measurements are seen in the right side of the display for the same signal.

Phase noise and jitter measurements (Opt. 11) on the RSA5000 Series may reduce the cost of your measurements by reducing the need for a dedicated phase noise tester. Outstanding phase noise across the operating range provides margin for many applications. Here, phase noise on a 13 MHz carrier is measured at -119 dBc/Hz at 10 kHz offset. The instrument phase noise of < -134 dBc/Hz at this frequency provides ample measurement margin for the task.

Settling time measurements (Opt. 12) are easy and automated. The user can select measurement bandwidth, tolerance bands, reference frequency (auto or manual), and establish up to 3 tolerance bands vs. time for Pass/Fail testing. Settling time may be referenced to external or internal trigger, and from the last settled frequency or phase. In the illustration, frequency settling time for a hopped oscillator is measured from an external trigger point from the device under test.

DPX Zero-span produces real-time analysis in amplitude, frequency, or phase vs. time. Up to 50,000 waveforms per second are processed. DPX Zero-span ensures that all time-domain anomalies are immediately found, reducing time-to-fault. Here, three distinct pulse shapes are captured in zero-span amplitude vs. time. Two of the three waveforms occur only once in 10,000 pulses, but all are displayed with DPX.

Analysis options for 802.11 standards are available. Here, an 802.11ac 160 MHz bandwidth signal is analyzed, with displays of EVM vs. subcarrier number and symbol number, channel response vs subcarrier with a summary of WLAN measurements, and the DPX spectrum of the analyzed signal. An EVM of -44.26 dB and other signal measurements are seen in the summary panel.

DPX Spectrograms provide gap-free spectral monitoring for up to days at a time. 60,000 traces can be recorded and reviewed, with resolution per line adjustable from 125 µs to 6400 s.

Noise Figure and Gain measurements (Option 14) help you to quickly and easily measure your device using the RTSA and a noise source. This image shows the measurement summary table with graphs of noise temperature, gain, noise figure and Y-factor.

The wide-bandwidth, high dynamic range options (B85HD, B125HD, and B16xHD) offer unmatched real time spectrum analysis dynamic range. Two 16-bit, 200 MS/sec digitizers are interleaved, resulting in 400 MS/sec acquisitions with a typical spurious free dynamic range of -80 dBc, up to 10 dB better than other commercially available instruments. Here, a signal at 3 GHz is measured at -13.71 dBm, with the largest spurious signal from the digitizer -87.89 dB below the carrier.

Fast validation of LTE base station transmitter with push button preset, and pass/fail information

Cumulative statistics provides timestamps for Min, Max values as well as Peak to Peak, Average and Standard deviation over multiple acquisitions, further extending the analysis. Histogram shows you outliers on the right and left

Pulse-Ogram displays a waterfall of multiple segmented captures, with correlated amplitude vs time and spectrum of each pulse. Can be used with an external trigger to show target range and speed
Documents
Tektronix RSA5106B 6.2 GHz Real-time Analyzer
Tektronix RSA5106B DatasheetOptions
Tektronix RSA5106B 6.2 GHz Real-time Analyzer
RSA5103B Real Time Signal Analyzer, 1 Hz to 3 GHz RSA5106B Real Time Signal Analyzer, 1 Hz to 6.2 GHz RSA5115B Real Time Signal Analyzer, 1 Hz to 15 GHz RSA5126B Real Time Signal Analyzer, 1 Hz to 26.5 GHz All Include: Quick-start Manual (Printed), Application Guide, Printable Online Help File, Programmer's manual (on CD), power cord, BNC-N adapter, USB Keyboard, USB Mouse, Front Cover. RSA5115B also includes: Planar Crown RF Input Connector - Type N Female PN 131-4329-00 RSA5126B also includes: Planar Crown RF Input Connector - 3.5 mm Female Note: Please specify power plug and language options when ordering.Warranty
One yearOptions, accessories, and upgrades
Options
| Product | Options | Description |
|---|---|---|
| RSA5103B | Real Time Signal Analyzer, 1 Hz to 3 GHz | |
| RSA5106B | Real Time Signal Analyzer, 1 Hz to 6.2 GHz | |
| RSA5115B | Real Time Signal Analyzer, 1 Hz to 15 GHz | |
| RSA5126B | Real Time Signal Analyzer, 1 Hz to 26.5 GHz | |
| Opt. B25 | 25 MHz Acquisition Bandwidth (no-cost option) | |
| Opt. B40 | 40 MHz Acquisition Bandwidth | |
| Opt. B85 | 85 MHz Acquisition Bandwidth | |
| Opt. B125 | 125 MHz Acquisition Bandwidth | |
| Opt. B16x | 165 MHz Acquisition Bandwidth | |
| Opt. B85HD | 85 MHz Acquisition Bandwidth, High Dynamic Range | |
| Opt. B125HD | 125 MHz Acquisition Bandwidth, High Dynamic Range | |
| Opt. B16xHD | 165 MHz Acquisition Bandwidth, High Dynamic Range | |
| Opt. 300 | High performance real time (Opt. 09 needed for performance improvement) | |
| Opt. 09 | Enhanced Real Time | |
| Opt. 10 | AM/FM/PM Modulation and Audio Measurements | |
| Opt. 11 | Phase Noise / Jitter Measurement | |
| Opt. 12 | Settling Time (Frequency and Phase) | |
| Opt. 14 | Noise Figure and Gain (Internal preamp recommended) | |
| Opt. 20 | Pulse Measurements | |
| Opt. 21 | General Purpose Modulation Analysis | |
| Opt. 22 | Flexible OFDM Analysis | |
| Opt. 23 | WLAN 802.11a/b/g/j/p measurement application | |
| Opt. 24 | WLAN 802.11n measurement application (requires opt 23) | |
| Opt. 25 | WLAN 802.11ac measurement application (requires opt 24) | |
| Opt. 26 | APCO P25 measurement application | |
| Opt. 27 | Bluetooth Basic LE Tx Measurements | |
| Opt. 28 | LTE Downlink RF measurements | |
| Opt. MAP | Mapping and signal strength | |
| Opt. 50 | Internal Preamp, 1 MHz to 3/6.2 GHz, RSA5103B/5106B only | |
| Opt. 51 | Internal Preamp, 1 MHz to 15/26.5 GHz, RSA5115B/5126B only | |
| Opt. 53 | Memory Extension, 4 GB Acquisition Memory Total | |
| Opt. 56 1 | Removable SSD, incompatible with Opt. 59 | |
| Opt. 59 1 | Internal HDD, incompatible with Opt. 56 (no cost option) | |
| Opt. 65 | Digital I and Q outputs | |
| Opt. 66 | Zero-span analog output | |
| Opt. 6566 | Digital I and Q outputs and Zero-span analog output | |
| Opt. PFR | Precision Frequency Reference | |
| Opt. 54 | Signal Classification and Survey |
1 Must order either Opt. 56 or 59.
Service options
- Opt. C3
- Calibration Service 3 Years
- Opt. C5
- Calibration Service 5 Years
- Opt. CA1
- Single Calibration or Functional Verification
- Opt. D1
- Calibration Data Report
- Opt. D3
- Calibration Data Report 3 Years (with Opt. C3)
- Opt. D5
- Calibration Data Report 5 Years (with Opt. C5)
- Opt. G3
- Complete Care 3 Years (includes loaner, scheduled calibration, and more)
- Opt. G5
- Complete Care 5 Years (includes loaner, scheduled calibration, and more)
- Opt. R5
- Repair Service 5 Years (including warranty)
Recommended accessories
| Accessory | Description |
|---|---|
| RTPA2A Spectrum Analyzer Probe Adapter compatibility | Supports TekConnect® probes. Compatibility P7225 - 2.5 GHz Active Probe, P7240 - 4 GHz Active Probe, P7260 - 6 GHz Active Probe, P7330 - 3.5 GHz Differential Probe, P7350 - 5 GHz Differential Probe, P7350SMA - 5 GHz Differential SMA Probe, P7340A - 4 GHz Z-Active Differential Probe, P7360A - 6 GHz Z-Active Differential Probe, P7380A - 8 GHz Z-Active Differential Probe, P7380SMA - 8 GHz Differential Signal Acquisition System, P7313 - >12.5 GHz Z-Active Differential Probe, P7313SMA - 13 GHz Differential SMA Probe, P7500 Series - 4 GHz to 20 GHz TriMode Probes |
| RSAVu | Software based on the RSA3000 Series platform for analysis supporting 3G wireless standards, WLAN (IEEE802.11a/b/g/n), RFID, Audio Demodulation, and more measurements. |
| SignalVu-PC | Software based on the RSA5000/6000 Series Real Time Signal Analyzers puts the power of your RTSA signal analysis tools on your Windows 7 or Windows 8.x 64-bit PC. Performs measurements on stored signals from RSA3/5/6K series, RSA306, MDO oscilloscope RF captures. |
| E and H Near-field Probes | For EMI troubleshooting. 119-4146-xx |
| Additional Removable Hard Drive | Order RSA5BUP Opt. SSD. This is an additional solid-state drive for instrument with Option 56 installed. (Windows 7 and instrument software preinstalled). |
| DC Block | Order 119-7902-00. 9 kHz-18 GHz. Type N Male to Type N Female. Voltage Rating: 50 V DC Max. Insertion Loss 0.9 dB. Aeroflex model 7003. |
| 101A EMC Probe Set | RF Probes. Contact Beehive Electronics to order: http://beehive-electronics.com/probes.html |
| 150A EMC Probe Amplifier | |
| 110A Probe Cable | |
| SMA Probe Adapter | |
| BNC Probe Adapter | |
| Noise source | NoiseCom NC346C Series. Provides supported sources up to 55 GHz in a variety of connector types and ENR values. Contact NoiseCom for full information and to order: http://noisecom.com |
| 131-4329-xx | Planar Crown RF Input Connector - 7005A-3 Type-N Female |
| 600 Ω BNC pass-through | Required for higher-speed noise figure measurements when ordering RSA5UP Opt 14 for RSA5000A. POMONA 4119-600 RF/COAXIAL ADAPTER, BNC PLUG-BNC JACK. Contact Pomona Electronics and distributors worldwide to order: http://pomonaelectronics.com |
| 131-9062-xx | Planar Crown RF Input Connector - 7005A-6 3.5 mm Female |
| 131-8822-xx | Planar Crown RF Input Connector - 7005A-7 3.5 mm Male |
| 131-8689-xx | Planar Crown RF Input Connector – 7005A-1 SMA Female |
| 015-0369-xx | RF Adapter – N (male) to SMA (male) |
| 119-6599-xx | Power Attenuator – 20 dB, 50 W, 5 GHz |
| Transit Case | 016-2026-xx |
| RSA56KR | Rackmount Retrofit |
| Additional Quick-start Manual (Paper) | 071-3224-xx |
| Additional Application Examples Manual (Paper) | 071-3283-xx |
RSA5BUP – Upgrade options for the RSA5100B series
| RSA5BUP | Option description | HW or SW | Factory calibration required? |
|---|---|---|---|
| Opt. PFR | Precision Frequency Reference | HW | Yes |
| Opt. SSD | Additional removable solid-state drive for units equipped with Option 56. Minimum capacity 480 GB. Windows 7 and instrument software preinstalled. | HW | No |
| Opt. 50 | Internal Preamp 1 MHz to 3 GHz (RSA5103B) or 1 MHz to 6.2 GHz (RSA5106B) | HW | Yes |
| Opt. 51 | Internal Preamp 1 MHz to 15 GHz (RSA5115B) or 1 MHz to 26.5 GHz (RSA5126B) | SW | No |
| Opt. 53 | Memory Extension, 4 GB Acquisition Memory total | HW | No |
| Opt. 54 | Signal Classification and Survey | SW | No |
| Opt. 65 | Digital I and Q outputs | HW | No |
| Opt. 66 | Zero-span analog output | HW | No |
| Opt. 6566 | Digital I and Q outputs and Zero-span analog output | HW | No |
| Opt. 56 | Removable Solid-State Drive (460 GB), incompatible with Opt. 59 | HW | No |
| Opt. 59 | Internal HDD (160 GB), incompatible with Opt. 56 | HW | No |
| Opt. 09 | Enhanced Real Time | SW | No |
| Opt. 10 | AM/FM/PM Modulation and Audio Measurements | SW | No |
| Opt. 11 | Phase Noise / Jitter Measurements | SW | No |
| Opt. 12 | Settling Time (Frequency and Phase) | SW | No |
| Opt. 14 | Noise Figure and Gain (Internal preamp recommended) | SW | No |
| Opt. 20 | Pulse Measurements | SW | No |
| Opt. 21 | General Purpose Modulation Analysis | SW | No |
| Opt. 22 | Flexible OFDM Analysis | SW | No |
| Opt. 23 | WLAN 802.11a/b/g/j/p measurement application | SW | No |
| Opt. 24 | WLAN 802.11n measurement application (requires opt 23) | SW | No |
| Opt. 25 | WLAN 802.11ac measurement application (requires opt 24) | SW | No |
| Opt. 26 | APCO P25 measurement application | SW | No |
| Opt. 27 | Bluetooth Basic LE Tx Measurements | SW | No |
| Opt. 28 | LTE Downlink RF measurements | SW | No |
| Opt. MAP | Mapping and signal strength | SW | No |
| Opt. B40 | 40 MHz Acquisition Bandwidth (from 25 MHz BW) | SW | No |
| Opt. B85 | 85 MHz Acquisition Bandwidth (from 25 MHz BW) | HW | Yes |
| Opt. B85E | 85 MHz Acquisition Bandwidth (from 40 MHz BW) | HW | Yes |
| Opt. B16x | 165 MHz Acquisition Bandwidth (from 25 MHz BW) | HW | Yes |
| Opt. B16xE | 165 MHz Acquisition Bandwidth (from 40 MHz BW) | HW | Yes |
| Opt. B16xH | 165 MHz Acquisition Bandwidth (from 85 MHz BW) | SW | No |
| Opt. B125 | 125 MHz acquisition bandwidth (from 25 MHz BW) | HW | Yes |
| Opt. B125E | 125 MHz acquisition bandwidth (from 40 MHz BW) | HW | Yes |
| Opt. B125H | 125 MHz acquisition bandwidth (from 85 MHz BW) | SW | No |
| Opt. B125HD-125 | High dynamic range, 125 MHz acquisition bandwidth (from 125 MHz BW) | HW | Yes |
| Opt. B125HD-25 | High dynamic range, 125 MHz acquisition bandwidth (from 25 MHz BW) | HW | Yes |
| Opt. B125HD-40 | High dynamic range, 125 MHz acquisition bandwidth (from 40 MHz BW) | HW | Yes |
| Opt. B125HD-85 | High dynamic range, 125 MHz acquisition bandwidth (from 85 MHz BW) | HW | No |
| Opt. B16xHD-125 | High dynamic range, 165 MHz acquisition bandwidth (from 125 MHz BW) | HW | No |
| Opt. B16xHD-165 | High dynamic range, 165 MHz acquisition bandwidth (from 165 MHz BW) | HW | No |
| Opt. B16xHD-25 | High dynamic range, 165 MHz acquisition bandwidth (from 25 MHz BW) | HW | Yes |
| Opt. B16xHD-40 | High dynamic range, 165 MHz acquisition bandwidth (from 40 MHz BW) | HW | Yes |
| Opt. B16xHD-85 | High dynamic range, 165 MHz acquisition bandwidth (from 85 MHz BW) | HW | No |
| Opt. B16xK | 165 MHz acquisition bandwidth (from 125 MHz BW) | HW | No |
| Opt. B85HD-25 | High dynamic range, 85 MHz acquisition bandwidth (from 25 MHz BW) | HW | Yes |
| Opt. B85HD-40 | High dynamic range, 85 MHz acquisition bandwidth (from 40 MHz BW) | HW | Yes |
| Opt. B85HD-85 | High dynamic range, 85 MHz acquisition bandwidth (from 85 MHz BW) | HW | No |
| Opt. 300 | High performance real time | HW | No |
Video
Tektronix RSA5106B 6.2 GHz Real-time Analyzer
The RSA5106B Real Time Signal Analyzers replace conventional instruments, offering the measurement confidence and functionality you demand for everyday tasks. The RSA5106B offers industry-leading real time specifications and includes best minimum signal duration for 100% probability of intercept and best real time dynamic range. With the RSA5106B, you get the functionality of a high-performance spectrum analyzer, wideband vector signal analyzer, and the unique trigger-capture-analyze capability of a real-time spectrum analyzer – all in a single package.Key performance specifications
- +17 dBm 3rd order intercept at 2 GHz
- ±0.3 dB absolute amplitude accuracy to 3 GHz
- Displayed average noise level: –142 dBm/Hz at 26.5 GHz, –157 dBm/Hz at 2 GHz and –150 dBm/Hz at 10 kHz
- Internal Preamp available: DANL of -156 dBm/Hz at 26.5 GHz, -167 dBm/Hz at 2 GHz
- Phase noise: –113 dBc/Hz at 1 GHz and –134 dBc/Hz at 10 MHz carrier frequency, 10 kHz offset
- High-speed sweeps with high resolution and low noise: 1 GHz sweeps at 10 kHz RBW in <1 second
- Real time spurious free dynamic range of 80 dB with HD options
Key features
- Reduce Time-to-Fault and increase design confidence with Real-time Signal Processing
- Up to 3,125,000 spectrums per second, enables 100% probability of intercept for signals of 0.434 μs
- Swept DPX spectrum enables unprecedented signal discovery over full frequency range
- Advanced DPX including swept DPX, gap-free DPX spectrograms, and DPX zero span with real-time amplitude, frequency, or phase
- Triggers zero in on the Problem
- DPX density™ trigger on single occurrences as brief as 0.434 μs in frequency domain and distinguish between continuous signals vs infrequent events
- Advanced time-qualified, runt, and frequency-edge triggers act on complex signals as brief as 20 ns
- Capture the widest and deepest signals
- 25, 40, 85, 125, or 165 MHz acquisition bandwidths
- Spurious-free dynamic range of 80 dB over the entire acquisition bandwidth with HD options
- Acquire more than 5 seconds at 165 MHz bandwidth
- Wideband preselection filter provides image free measurements in entire analysis bandwidth up to 165 MHz
- More standard analysis than you expect in an everyday tool
- Measurements including channel power, ACLR, CCDF, OBW/EBW, spur search, EMI detectors
- Amplitude, frequency, phase vs. time, DPX spectrum, and spectrograms
- Correlated multi-domain displays
- Performance options for best real time and dynamic range and analysis options offer added value
- High dynamic range options offer unmatched 80 dBc spurious-free analysis in the widest acquisition bandwidth
- High performance DPX offers industry-leading minumum signal duration for 100% probability of intercept
- Optional software applications to add dedicated measurements for specific applications and standards
- AM/FM/PM modulation and audio measurements (Opt. 10)
- Phase noise and jitter (Opt. 11)
- Automated settling time measurements (frequency and phase) (Opt. 12)
- More than 30 pulse measurements, acquisition of more than 200,000 pulses possible for post analysis and cumulative statistics. (Opt. 20)
- General purpose modulation analysis of more than 20 modulation types (Opt. 21)
- Simple and complete APCO Project 25 transmitter compliance testing and analysis for Phase 1 (C4FM) and Phase 2 (TDMA) (Opt. 26)
- WLAN analysis for 802.11 a/b/g/j/p, 802.11n, and 802.11ac (Opts. 23, 24, 25)
- Noise figure and gain measurements (Opt. 14)
- Bluetooth® Analysis (Opt. 27)
- Manual and automatic measurement mapping plus signal strength function provides audio tone and visual indication of received signal strength (Opt. MAP)
- LTE™ FDD and TDD Base Station (eNB) Transmitter RF measurements (Opt. 28)
- Signal Classification and Survey
Applications
- Wideband radar and pulsed RF signals
- Frequency agile communications
- Broadband satellite and microwave backhaul links
- Education
- Long Term Evolution (LTE), Cellular
High performance spectrum and vector signal analysis, and much more
The RSA5106B replaces conventional high-performance signal analyzers, offering the measurement confidence and functionality you demand for everyday tasks. A +17 dBm TOI and -157 dBm/Hz DANL at 2 GHz gives you the dynamic range you expect for challenging spectrum analysis measurements. All analysis is fully preselected and image free. You never have to compromise between dynamic range and analysis bandwidth by 'switching out the preselector'.A complete toolset of power and signal statistics measurements are standard, including Channel Power, ACLR, CCDF, Occupied Bandwidth, AM/FM/PM, and Spurious measurements. Available Phase Noise and General Purpose Modulation Analysis measurements round out the expected set of high-performance analysis tools.
But, just being an excellent mid-range signal analyzer is not sufficient to meet the demands of today's hopping, transient signals.
The RSA5106B will help you to easily discover design issues that other signal analyzers may miss. The revolutionary DPX®spectrum display offers an intuitive live color view of signal transients changing over time in the frequency domain, giving you immediate confidence in the stability of your design, or instantly displaying a fault when it occurs. Once a problem is discovered with DPX®, the RSA5000 Series spectrum analyzers can be set to trigger on the event, capture a contiguous time record of changing RF events, and perform time-correlated analysis in all domains. You get the functionality of a high-performance spectrum analyzer, wideband vector signal analyzer, and the unique trigger-capture-analyze capability of a real-time spectrum analyzer - all in a single package.
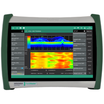
Revolutionary DPX ® spectrum display reveals transient signal behavior that helps you discover instability, glitches, and interference. Here, three distinct signals can be seen. Two high-level signals of different frequency-of-occurrence are seen in light and dark blue, and a third signal beneath the center signal can also be discerned. The DPX Density™ trigger allows the user to acquire signals for analysis only when this third signal is present. Trigger On This™ has been activated, and a density measurement box is automatically opened, measuring a signal density 7.275%. Any signal density greater than the measured value will cause a trigger event.
Discover
The patented DPX®spectrum processing engine brings live analysis of transient events to spectrum analyzers. Performing up to 3,125,000 frequency transforms per second, transients of a minimum event duration of 0.434 μs in length are displayed in the frequency domain. This is orders of magnitude faster than swept analysis techniques. Events can be color coded by rate of occurrence onto a bitmapped display, providing unparalleled insight into transient signal behavior. The DPX spectrum processor can be swept over the entire frequency range of the instrument, enabling broadband transient capture previously unavailable in any spectrum analyzer. In applications that require only spectral information, DPX provides gap-free spectral recording, replay, and analysis of up to 60,000 spectral traces. Spectrum recording resolution is variable from 125 µs to 6400 s per line.Trigger
Tektronix has a long history of innovative triggering capability, and the RSA Series spectrum analyzers lead the industry in triggered signal analysis. The RSA5000 Series provides unique triggers essential for troubleshooting modern digitally implemented RF systems, including time-qualified power, runt, density, frequency, and frequency mask triggers.Time qualification can be applied to any internal trigger source, enabling capture of 'the short pulse' or 'the long pulse' in a pulse train, or, when applied to the Frequency Mask Trigger, only triggering when a frequency domain event lasts for a specified time. Runt triggers capture troublesome infrequent pulses that either turn on or turn off to an incorrect level, greatly reducing time to fault.
DPX Density™ Trigger works on the measured frequency of occurrence or density of the DPX display. The unique Trigger On This™ function allows the user to simply point at the signal of interest on the DPX display, and a trigger level is automatically set to trigger slightly below the measured density level. You can capture low-level signals in the presence of high-level signals at the click of a button.
The Frequency Mask Trigger (FMT) is easily configured to monitor all changes in frequency occupancy within the acquisition bandwidth.
A Power Trigger working in the time domain can be armed to monitor for a user-set power threshold. Resolution bandwidths may be used with the power trigger for band limiting and noise reduction. Two external triggers are available for synchronization to test system events.
Trigger and Capture: The DPX Density™ Trigger monitors for changes in the frequency domain, and captures any violations into memory. The spectrogram display (left panel) shows frequency and amplitude changing over time. By selecting the point in time in the spectrogram where the spectrum violation triggered the DPX Density™ Trigger, the frequency domain view (right panel) automatically updates to show the detailed spectrum view at that precise moment in time.
Capture
Real-time capture of small signals in the presence of large signals is enabled with greater than 70 dB SFDR in all acquisition bandwidths, even up to 165 MHz (Opt. B16x). The dynamic range of the wideband acquisition system can be improved to an unmatched 80 dB with the B85HD, B125HD, and B16xHD options. Capture once - make multiple measurements without recapturing. All signals in an acquisition bandwidth are recorded into the RSA5000 Series deep memory. Record lengths vary depending upon the selected acquisition bandwidth - up to 5.36 seconds at 165 MHz, 343.5 seconds at 1 MHz, or 6.1 hours at 10 kHz bandwidth with Memory Extension (Opt. 53). Acquisitions of up to 2 GB in length can be stored in MATLAB™ Level 5 format for offline analysis.Most spectrum analyzers use narrowband tunable band pass filters, often YIG tuned filters (YTF) to serve as a preselector. These filters provide image rejection and improve spurious performance in swept applications by limiting the number of signals present at the first mixing stage. YTF's are narrow band devices by nature and are usually limited to bandwidths less than 50 MHz. These analyzers bypass the input filter when performing wideband analysis, leaving them susceptible to image responses when operating in modes where wideband analysis is required such as for real time signal analysis.
Unlike spectrum analyzers with YTF's, Tektronix Real Time Signal Analyzers use a wideband image-free architecture guaranteeing that signals at frequencies outside of the band to which the instrument is tuned don't create spurious or image responses. This image-free response is achieved with a series of input filters designed such that all image responses are suppressed. The input filters are overlapped by greater than the widest acquisition bandwidth, ensuring that full-bandwidth acquisitions are always available. This series of filters serves the purpose of the preselector used by other spectrum analyzers, but has the benefit of always being on while still providing the image-free response in all instrument bandwidth settings and at all frequencies.
Analyze
The RSA5106B offers analysis capabilities that advance productivity for engineers working on components or in RF system design, integration, and performance verification, or operations engineers working in networks, or spectrum management. In addition to spectrum analysis, spectrograms display both frequency and amplitude changes over time. Time-correlated measurements can be made across the frequency, phase, amplitude, and modulation domains. This is ideal for signal analysis that includes frequency hopping, pulse characteristics, modulation switching, settling time, bandwidth changes, and intermittent signals.The measurement capabilities of the RSA5106B and available options and software packages are summarized in the following section.
Measurement functions
| Standard measurements | Description |
|---|---|
| Spectrum analyzer measurements | Channel power, Adjacent channel power, Multicarrier adjacent channel power/leakage ratio, Spectrum emissions mask, Occupied bandwidth, xdB down, dBm/Hz marker, dBc/Hz marker |
| Real time measurements | DPX Spectrum with density measurements, DPX Spectrogram with spectrums vs. time, Zero-Span DPX with up to 50,000 updates/sec |
| Time domain and statistical measurements | RF IQ vs Time, Power vs Time, Frequency vs Time, Phase vs Time, CCDF, Peak-to-Average Ratio |
| Spur search measurement | Up to 20 frequency ranges, user-selected detectors (Peak, Average, QP), filters (RBW, CISPR, MIL), and VBW in each range. Linear or log frequency scale. Measurements and violations in absolute power or relative to a carrier. Up to 999 violations identified in tabular form for export in .CSV format |
| Analog modulation analysis measurement functions | % amplitude modulation (+, -, total) frequency modulation (±Peak, +Peak, -Peak, RMS, Peak-Peak/2, frequency error) phase modulation (±Peak, RMS, +Peak, -Peak) |
| DPX density measurement | Measures % signal density at any location on the DPX spectrum display and triggers on specified signal density |
| Measurement options | Description |
|---|---|
| AM/FM/PM modulation and audio measurements (Opt. 10) | carrier power, frequency error, modulation frequency, modulation parameters (±Peak, Peak-Peak/2, RMS), SINAD, modulation distortion, S/N, THD, TNHD |
| Phase noise and jitter measurements (Opt. 11) | 10 Hz to 1 GHz frequency offset range, log frequency scale traces - 2: ±Peak trace, average trace, trace smoothing, and averaging |
| Settling Time (Frequency and Phase) (Opt. 12) | Measured frequency, Settling time from last settled frequency, Settling time from last settled phase, Settling time from trigger. Automatic or manual reference frequency selection. User-adjustable measurement bandwidth, averaging, and smoothing. Pass/Fail mask testing with 3 user-settable zones |
| Noise Figure and Gain measurements (Opt. 14) | Measurement displays of noise figure, gain, Y-factor, noise temperature, and tabular results. Single-frequency metering and swept-trace results are available. Support for industry-standard noise sources. Measures amplifiers and other non-frequency converting devices plus fixed local-oscillator up and down converters. Performs mask testing to user-defined limits. Built in uncertainty calculator. |
| Advanced pulse measurements suite (Opt. 20) | Pulse-Ogram™ waterfall display of multiple segmented captures, with amplitude vs time and spectrum of each pulse. Pulse frequency, Delta Frequency, Average on power, Peak power, Average transmitted power, Pulse width, Rise time, Fall time, Repetition interval (seconds), Repetition interval (Hz), Duty factor (%), Duty factor (ratio), Ripple (dB), Ripple (%), Droop (dB), Droop (%), Overshoot (dB), Overshoot (%), Pulse- Ref Pulse frequency difference, Pulse- Ref Pulse phase difference, Pulse- Pulse frequency difference, Pulse- Pulse phase difference, RMS frequency error, Max frequency error, RMS phase error, Max phase error, Frequency deviation, Phase deviation, Impulse response (dB), Impulse response (time), Time stamp. |
| General Purpose Digital Modulation Analysis (Opt. 21) | Error vector magnitude (EVM) (RMS, Peak, EVM vs time), Modulation error ratio (MER), Magnitude error (RMS, Peak, Mag error vs time), Phase error (RMS, Peak, Phase error vs time), Origin offset, Frequency error, Gain imbalance, Quadrature error, Rho, Constellation, Symbol table |
| Flexible OFDM Analysis (Opt. 22) | OFDM analysis for WLAN 802.11a/j/g and WiMAX 802.16-2004 |
| WLAN 802.11a/b/g/j/p measurement application (Opt. 23) | All of the RF transmitter measurements as defined in the IEEE standard, as well as a wide range of additional measurements including Carrier Frequency error, Symbol Timing error, Average/peak burst power, IQ Origin Offset, RMS/Peak EVM, and analysis displays, such as EVM and Phase/Magnitude Error vs. time/frequency or vs. symbols/ subcarriers, as well as packet header decoded information and symbol table.Option 24 requires option 23.Option 25 requires option 24. |
| WLAN 802.11n measurement application (Opt. 24) | |
| WLAN 802.11ac measurement application (Opt. 25) | |
| APCO P25 compliance testing and analysis application (Opt. 26) | Complete set of push-button TIA-102 standard-based transmitter measurements with pass/fail results including ACPR, transmitter power and encoder attack times, transmitter throughput delay, frequency deviation, modulation fidelity, symbol rate accuracy, and transient frequency behavior, as well as HCPM transmitter logical channel peak ACPR, off slot power, power envelope and time alignment. |
| Bluetooth Basic LE TX SIG measurements (Opt. 27) | Presets for transmitter measurements defined by Bluetooth SIG for Basic Rate and Bluetooth Low Energy. Results also include Pass/Fail information. Application also provides packet header field decoding and can automatically detect the standard, including Enhanced Data Rate. |
| LTE Downlink RF measurements (Opt. 28) | Presets for Cell ID, ACLR, SEM, Channel Power and TDD Toff Power. Supports TDD and FDD frame format and all base stations defined by 3GPP TS version 12.5. Results include Pass/Fail information. Real-Time settings make the ACLR and the SEM measurements fast, if the connected instrument has enough bandwidth. |
| Mapping and signal strength (Opt. MAP) | Both manual and automatic drive test are supported by built-in mapping software. Commercial off-the-shelf 3rd party GPS receiver supported via USB or Bluetooth® connection. Supports MapInfo format and scanned version maps. Also supports exporting to popular Google Earth and MapInfo map format for post analysis. Signal strength measurement provides both a visual indicator and audible tone of signal strength. |
| RSAVu Analysis Software | W-CDMA, HSUPA. HSDPA, GSM/EDGE, CDMA2000 1x, CDMA2000 1xEV-DO, RFID, Phase noise, Jitter, IEEE 802.11 a/b/g/n WLAN, IEEE 802.15.4 OQPSK (Zigbee), Audio analysis |
| Signal Classification | The signal classification application enables expert systems guidance to aid the user in classifying signals. It provides graphical tools that allow you to quickly create a spectral region of interest, enabling you to classify and sort signals efficiently. |
Swept DPX can capture low-probability events across spans greater than the real time bandwidth. Here, a 1 GHz sweep views the activity form 1.9 GHz to 2.9 GHz from an off-air antenna. Number signals in the 1.9 GHz cell band are seen, and significant activity in the 2.4 GHz ISM band is apparent. The density measurement both has been used on the largest signal near the center, displaying approximately 3.5% occupancy.
In this illustration, a single region has been selected. Since we have declared this to be an 802.11g signal, the spectrum mask for the 802.11g signal is shown overlaid in the region. The signal is a close match to the spectrum mask, However we can see some interferences with some likely Bluetooth signals in the ISM band
Time-correlated views in multiple domains provide a new level of insight into design problems not possible with conventional analyzers. Here, modulation quality and the constellation measurements are combined with the continuous monitoring of the DPX ® spectrum display.
Spurious Search - Up to 20 noncontiguous frequency regions can be defined, each with their own resolution bandwidth, video bandwidth, detector (peak, average, quasi-peak), and limit ranges. Test results can be exported in .CSV format to external programs, with up to 999 violations reported. Spectrum results are available in linear or log scale.
Audio monitoring and modulation measurements simultaneously can make spectrum management an easier, faster task. Here, the DPX spectrum display shows a live spectrum of the signal of interest and simultaneously provides demodulated audio to the internal instrument loudspeaker. FM deviation measurements are seen in the right side of the display for the same signal.
Phase noise and jitter measurements (Opt. 11) on the RSA5000 Series may reduce the cost of your measurements by reducing the need for a dedicated phase noise tester. Outstanding phase noise across the operating range provides margin for many applications. Here, phase noise on a 13 MHz carrier is measured at -119 dBc/Hz at 10 kHz offset. The instrument phase noise of < -134 dBc/Hz at this frequency provides ample measurement margin for the task.
Settling time measurements (Opt. 12) are easy and automated. The user can select measurement bandwidth, tolerance bands, reference frequency (auto or manual), and establish up to 3 tolerance bands vs. time for Pass/Fail testing. Settling time may be referenced to external or internal trigger, and from the last settled frequency or phase. In the illustration, frequency settling time for a hopped oscillator is measured from an external trigger point from the device under test.
DPX Zero-span produces real-time analysis in amplitude, frequency, or phase vs. time. Up to 50,000 waveforms per second are processed. DPX Zero-span ensures that all time-domain anomalies are immediately found, reducing time-to-fault. Here, three distinct pulse shapes are captured in zero-span amplitude vs. time. Two of the three waveforms occur only once in 10,000 pulses, but all are displayed with DPX.
Analysis options for 802.11 standards are available. Here, an 802.11ac 160 MHz bandwidth signal is analyzed, with displays of EVM vs. subcarrier number and symbol number, channel response vs subcarrier with a summary of WLAN measurements, and the DPX spectrum of the analyzed signal. An EVM of -44.26 dB and other signal measurements are seen in the summary panel.
DPX Spectrograms provide gap-free spectral monitoring for up to days at a time. 60,000 traces can be recorded and reviewed, with resolution per line adjustable from 125 µs to 6400 s.
Noise Figure and Gain measurements (Option 14) help you to quickly and easily measure your device using the RTSA and a noise source. This image shows the measurement summary table with graphs of noise temperature, gain, noise figure and Y-factor.
The wide-bandwidth, high dynamic range options (B85HD, B125HD, and B16xHD) offer unmatched real time spectrum analysis dynamic range. Two 16-bit, 200 MS/sec digitizers are interleaved, resulting in 400 MS/sec acquisitions with a typical spurious free dynamic range of -80 dBc, up to 10 dB better than other commercially available instruments. Here, a signal at 3 GHz is measured at -13.71 dBm, with the largest spurious signal from the digitizer -87.89 dB below the carrier.
Fast validation of LTE base station transmitter with push button preset, and pass/fail information
Cumulative statistics provides timestamps for Min, Max values as well as Peak to Peak, Average and Standard deviation over multiple acquisitions, further extending the analysis. Histogram shows you outliers on the right and left
Pulse-Ogram displays a waterfall of multiple segmented captures, with correlated amplitude vs time and spectrum of each pulse. Can be used with an external trigger to show target range and speed
Tektronix RSA5106B 6.2 GHz Real-time Analyzer
Tektronix RSA5106B DatasheetTektronix RSA5106B 6.2 GHz Real-time Analyzer
RSA5103B Real Time Signal Analyzer, 1 Hz to 3 GHz RSA5106B Real Time Signal Analyzer, 1 Hz to 6.2 GHz RSA5115B Real Time Signal Analyzer, 1 Hz to 15 GHz RSA5126B Real Time Signal Analyzer, 1 Hz to 26.5 GHz All Include: Quick-start Manual (Printed), Application Guide, Printable Online Help File, Programmer's manual (on CD), power cord, BNC-N adapter, USB Keyboard, USB Mouse, Front Cover. RSA5115B also includes: Planar Crown RF Input Connector - Type N Female PN 131-4329-00 RSA5126B also includes: Planar Crown RF Input Connector - 3.5 mm Female Note: Please specify power plug and language options when ordering.Warranty
One yearOptions, accessories, and upgrades
Options
| Product | Options | Description |
|---|---|---|
| RSA5103B | Real Time Signal Analyzer, 1 Hz to 3 GHz | |
| RSA5106B | Real Time Signal Analyzer, 1 Hz to 6.2 GHz | |
| RSA5115B | Real Time Signal Analyzer, 1 Hz to 15 GHz | |
| RSA5126B | Real Time Signal Analyzer, 1 Hz to 26.5 GHz | |
| Opt. B25 | 25 MHz Acquisition Bandwidth (no-cost option) | |
| Opt. B40 | 40 MHz Acquisition Bandwidth | |
| Opt. B85 | 85 MHz Acquisition Bandwidth | |
| Opt. B125 | 125 MHz Acquisition Bandwidth | |
| Opt. B16x | 165 MHz Acquisition Bandwidth | |
| Opt. B85HD | 85 MHz Acquisition Bandwidth, High Dynamic Range | |
| Opt. B125HD | 125 MHz Acquisition Bandwidth, High Dynamic Range | |
| Opt. B16xHD | 165 MHz Acquisition Bandwidth, High Dynamic Range | |
| Opt. 300 | High performance real time (Opt. 09 needed for performance improvement) | |
| Opt. 09 | Enhanced Real Time | |
| Opt. 10 | AM/FM/PM Modulation and Audio Measurements | |
| Opt. 11 | Phase Noise / Jitter Measurement | |
| Opt. 12 | Settling Time (Frequency and Phase) | |
| Opt. 14 | Noise Figure and Gain (Internal preamp recommended) | |
| Opt. 20 | Pulse Measurements | |
| Opt. 21 | General Purpose Modulation Analysis | |
| Opt. 22 | Flexible OFDM Analysis | |
| Opt. 23 | WLAN 802.11a/b/g/j/p measurement application | |
| Opt. 24 | WLAN 802.11n measurement application (requires opt 23) | |
| Opt. 25 | WLAN 802.11ac measurement application (requires opt 24) | |
| Opt. 26 | APCO P25 measurement application | |
| Opt. 27 | Bluetooth Basic LE Tx Measurements | |
| Opt. 28 | LTE Downlink RF measurements | |
| Opt. MAP | Mapping and signal strength | |
| Opt. 50 | Internal Preamp, 1 MHz to 3/6.2 GHz, RSA5103B/5106B only | |
| Opt. 51 | Internal Preamp, 1 MHz to 15/26.5 GHz, RSA5115B/5126B only | |
| Opt. 53 | Memory Extension, 4 GB Acquisition Memory Total | |
| Opt. 56 1 | Removable SSD, incompatible with Opt. 59 | |
| Opt. 59 1 | Internal HDD, incompatible with Opt. 56 (no cost option) | |
| Opt. 65 | Digital I and Q outputs | |
| Opt. 66 | Zero-span analog output | |
| Opt. 6566 | Digital I and Q outputs and Zero-span analog output | |
| Opt. PFR | Precision Frequency Reference | |
| Opt. 54 | Signal Classification and Survey |
1 Must order either Opt. 56 or 59.
Service options
- Opt. C3
- Calibration Service 3 Years
- Opt. C5
- Calibration Service 5 Years
- Opt. CA1
- Single Calibration or Functional Verification
- Opt. D1
- Calibration Data Report
- Opt. D3
- Calibration Data Report 3 Years (with Opt. C3)
- Opt. D5
- Calibration Data Report 5 Years (with Opt. C5)
- Opt. G3
- Complete Care 3 Years (includes loaner, scheduled calibration, and more)
- Opt. G5
- Complete Care 5 Years (includes loaner, scheduled calibration, and more)
- Opt. R5
- Repair Service 5 Years (including warranty)
Recommended accessories
| Accessory | Description |
|---|---|
| RTPA2A Spectrum Analyzer Probe Adapter compatibility | Supports TekConnect® probes. Compatibility P7225 - 2.5 GHz Active Probe, P7240 - 4 GHz Active Probe, P7260 - 6 GHz Active Probe, P7330 - 3.5 GHz Differential Probe, P7350 - 5 GHz Differential Probe, P7350SMA - 5 GHz Differential SMA Probe, P7340A - 4 GHz Z-Active Differential Probe, P7360A - 6 GHz Z-Active Differential Probe, P7380A - 8 GHz Z-Active Differential Probe, P7380SMA - 8 GHz Differential Signal Acquisition System, P7313 - >12.5 GHz Z-Active Differential Probe, P7313SMA - 13 GHz Differential SMA Probe, P7500 Series - 4 GHz to 20 GHz TriMode Probes |
| RSAVu | Software based on the RSA3000 Series platform for analysis supporting 3G wireless standards, WLAN (IEEE802.11a/b/g/n), RFID, Audio Demodulation, and more measurements. |
| SignalVu-PC | Software based on the RSA5000/6000 Series Real Time Signal Analyzers puts the power of your RTSA signal analysis tools on your Windows 7 or Windows 8.x 64-bit PC. Performs measurements on stored signals from RSA3/5/6K series, RSA306, MDO oscilloscope RF captures. |
| E and H Near-field Probes | For EMI troubleshooting. 119-4146-xx |
| Additional Removable Hard Drive | Order RSA5BUP Opt. SSD. This is an additional solid-state drive for instrument with Option 56 installed. (Windows 7 and instrument software preinstalled). |
| DC Block | Order 119-7902-00. 9 kHz-18 GHz. Type N Male to Type N Female. Voltage Rating: 50 V DC Max. Insertion Loss 0.9 dB. Aeroflex model 7003. |
| 101A EMC Probe Set | RF Probes. Contact Beehive Electronics to order: http://beehive-electronics.com/probes.html |
| 150A EMC Probe Amplifier | |
| 110A Probe Cable | |
| SMA Probe Adapter | |
| BNC Probe Adapter | |
| Noise source | NoiseCom NC346C Series. Provides supported sources up to 55 GHz in a variety of connector types and ENR values. Contact NoiseCom for full information and to order: http://noisecom.com |
| 131-4329-xx | Planar Crown RF Input Connector - 7005A-3 Type-N Female |
| 600 Ω BNC pass-through | Required for higher-speed noise figure measurements when ordering RSA5UP Opt 14 for RSA5000A. POMONA 4119-600 RF/COAXIAL ADAPTER, BNC PLUG-BNC JACK. Contact Pomona Electronics and distributors worldwide to order: http://pomonaelectronics.com |
| 131-9062-xx | Planar Crown RF Input Connector - 7005A-6 3.5 mm Female |
| 131-8822-xx | Planar Crown RF Input Connector - 7005A-7 3.5 mm Male |
| 131-8689-xx | Planar Crown RF Input Connector – 7005A-1 SMA Female |
| 015-0369-xx | RF Adapter – N (male) to SMA (male) |
| 119-6599-xx | Power Attenuator – 20 dB, 50 W, 5 GHz |
| Transit Case | 016-2026-xx |
| RSA56KR | Rackmount Retrofit |
| Additional Quick-start Manual (Paper) | 071-3224-xx |
| Additional Application Examples Manual (Paper) | 071-3283-xx |
RSA5BUP – Upgrade options for the RSA5100B series
| RSA5BUP | Option description | HW or SW | Factory calibration required? |
|---|---|---|---|
| Opt. PFR | Precision Frequency Reference | HW | Yes |
| Opt. SSD | Additional removable solid-state drive for units equipped with Option 56. Minimum capacity 480 GB. Windows 7 and instrument software preinstalled. | HW | No |
| Opt. 50 | Internal Preamp 1 MHz to 3 GHz (RSA5103B) or 1 MHz to 6.2 GHz (RSA5106B) | HW | Yes |
| Opt. 51 | Internal Preamp 1 MHz to 15 GHz (RSA5115B) or 1 MHz to 26.5 GHz (RSA5126B) | SW | No |
| Opt. 53 | Memory Extension, 4 GB Acquisition Memory total | HW | No |
| Opt. 54 | Signal Classification and Survey | SW | No |
| Opt. 65 | Digital I and Q outputs | HW | No |
| Opt. 66 | Zero-span analog output | HW | No |
| Opt. 6566 | Digital I and Q outputs and Zero-span analog output | HW | No |
| Opt. 56 | Removable Solid-State Drive (460 GB), incompatible with Opt. 59 | HW | No |
| Opt. 59 | Internal HDD (160 GB), incompatible with Opt. 56 | HW | No |
| Opt. 09 | Enhanced Real Time | SW | No |
| Opt. 10 | AM/FM/PM Modulation and Audio Measurements | SW | No |
| Opt. 11 | Phase Noise / Jitter Measurements | SW | No |
| Opt. 12 | Settling Time (Frequency and Phase) | SW | No |
| Opt. 14 | Noise Figure and Gain (Internal preamp recommended) | SW | No |
| Opt. 20 | Pulse Measurements | SW | No |
| Opt. 21 | General Purpose Modulation Analysis | SW | No |
| Opt. 22 | Flexible OFDM Analysis | SW | No |
| Opt. 23 | WLAN 802.11a/b/g/j/p measurement application | SW | No |
| Opt. 24 | WLAN 802.11n measurement application (requires opt 23) | SW | No |
| Opt. 25 | WLAN 802.11ac measurement application (requires opt 24) | SW | No |
| Opt. 26 | APCO P25 measurement application | SW | No |
| Opt. 27 | Bluetooth Basic LE Tx Measurements | SW | No |
| Opt. 28 | LTE Downlink RF measurements | SW | No |
| Opt. MAP | Mapping and signal strength | SW | No |
| Opt. B40 | 40 MHz Acquisition Bandwidth (from 25 MHz BW) | SW | No |
| Opt. B85 | 85 MHz Acquisition Bandwidth (from 25 MHz BW) | HW | Yes |
| Opt. B85E | 85 MHz Acquisition Bandwidth (from 40 MHz BW) | HW | Yes |
| Opt. B16x | 165 MHz Acquisition Bandwidth (from 25 MHz BW) | HW | Yes |
| Opt. B16xE | 165 MHz Acquisition Bandwidth (from 40 MHz BW) | HW | Yes |
| Opt. B16xH | 165 MHz Acquisition Bandwidth (from 85 MHz BW) | SW | No |
| Opt. B125 | 125 MHz acquisition bandwidth (from 25 MHz BW) | HW | Yes |
| Opt. B125E | 125 MHz acquisition bandwidth (from 40 MHz BW) | HW | Yes |
| Opt. B125H | 125 MHz acquisition bandwidth (from 85 MHz BW) | SW | No |
| Opt. B125HD-125 | High dynamic range, 125 MHz acquisition bandwidth (from 125 MHz BW) | HW | Yes |
| Opt. B125HD-25 | High dynamic range, 125 MHz acquisition bandwidth (from 25 MHz BW) | HW | Yes |
| Opt. B125HD-40 | High dynamic range, 125 MHz acquisition bandwidth (from 40 MHz BW) | HW | Yes |
| Opt. B125HD-85 | High dynamic range, 125 MHz acquisition bandwidth (from 85 MHz BW) | HW | No |
| Opt. B16xHD-125 | High dynamic range, 165 MHz acquisition bandwidth (from 125 MHz BW) | HW | No |
| Opt. B16xHD-165 | High dynamic range, 165 MHz acquisition bandwidth (from 165 MHz BW) | HW | No |
| Opt. B16xHD-25 | High dynamic range, 165 MHz acquisition bandwidth (from 25 MHz BW) | HW | Yes |
| Opt. B16xHD-40 | High dynamic range, 165 MHz acquisition bandwidth (from 40 MHz BW) | HW | Yes |
| Opt. B16xHD-85 | High dynamic range, 165 MHz acquisition bandwidth (from 85 MHz BW) | HW | No |
| Opt. B16xK | 165 MHz acquisition bandwidth (from 125 MHz BW) | HW | No |
| Opt. B85HD-25 | High dynamic range, 85 MHz acquisition bandwidth (from 25 MHz BW) | HW | Yes |
| Opt. B85HD-40 | High dynamic range, 85 MHz acquisition bandwidth (from 40 MHz BW) | HW | Yes |
| Opt. B85HD-85 | High dynamic range, 85 MHz acquisition bandwidth (from 85 MHz BW) | HW | No |
| Opt. 300 | High performance real time | HW | No |