


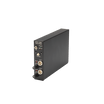


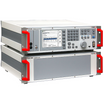

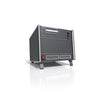

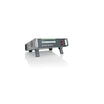


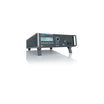


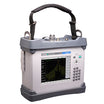


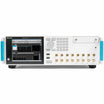

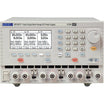


Tektronix RSA7100A Real Time Analyzer
Use our chat for personal support. Or contact us via +45 31 33 18 19 or salg@GOmeasure.dk
- Frequency Range: 19 kHz - 14/26.5 GHz
- Real-Time Bandwidth: 320/800 MHz
- Minimum Event Duration for 100% POI: 418 ns
- SFDR (typical): 65 dBc
:%2065%20dBc%0A
)
Discover the possibilities
More information
Description
Tektronix RSA7100A Real Time Analyzer
The Tektronix RSA7100A wideband signal analyzer offers real time spectrum analysis up to 800 MHz bandwidth, simultaneous streaming to multiple interfaces for record (up to 2 hours) and playback of seamless data at full bandwidth.The RSA7100A gives you the power to imagine new solutions
The RSA7100A is a high performance spectrum analyzer focused on wideband analysis and signal recording. By separating the RF acquisitions from the compute engine, a graphics processor can be used in place of previously required FPGA designs for real time processing. As processor capabilities advance, new performance can be easily maintained for the system with PC upgrades instead of RF hardware replacement, making the RSA7100A a smart choice for minimizing long term costs. You can also harness the power of this CPU/GPU combination in your own simulations and designs, using the instrument as a powerful workstation.The RSA7100A is designed for engineers working on the latest wideband designs in communications, radar and electronic warfare and for spectrum managers who need to see the effects of new wideband systems when fielded and operational.
Analysis of signals is enabled with two software packages. SignalVu-PC for real time, spectrum and vector signal analysis, and DataVu-PC for analysis of the very large file sets produced when recording wideband signals.
SignalVu-PC software offers rich analysis capability
The RSA7100 operates with SignalVu-PC, a powerful program used as the basis of Tek's traditional spectrum analyzers. SignalVu-PC offers a deep analysis capability including real time spectrum analysis and a wide variety of application packages. Real-time processing of the DPX® spectrum/spectrogram is enabled in your PC, further reducing the cost of hardware. A programmatic interface to SignalVu-PC is provided, offering all measurements and settings to external programs. Basic functionality of the free SignalVu-PC program is far from basic and includes the measurements shown below.| Measurements and functions included in SignalVu-PC base version | |
| General signal analysis | Description |
| Spectrum analyzer | Spans from 100 Hz to full range of the instrument, 3 traces + math and spectrogram trace, 5 markers with power, relative power, integrated power, power density and dBc/Hz functions |
| DPX spectrum/spectrogram | Real time display of spectrum with 100% probability of intercept of up to 419 nsec signals in up to 800 MHz span |
| Amplitude, frequency, phase vs. time, RF I and Q vs. time | Basic vector analysis functions |
| Time Overview/Navigator | Enables easy setting of acquisition and analysis times for deep analysis in multiple domains |
| Spectrogram | Analyze and re-analyze your signal in 2-D or 3-D waterfall display |
| Analog modulation analysis | Description |
| AM, FM, PM analysis | Measures key AM, FM, PM parameters |
| RF measurements | Description |
| Spurious measurement | User-defined limit lines and regions provide automatic spectrum violation testing across the entire range of the instrument. |
| Spectrum emission mask | User-set or standards-specific masks. |
| Occupied bandwidth | Measures 99% power, -xdB down points. |
| Channel power and ACLR | Variable channel and adjacent/alternate channel parameters. |
| MCPR | Sophisticated, flexible multi-channel power measurements. |
| CCDF | Complementary Cumulative Distribution Function plots the statistical variations in signal level. |
| Signal strength | Measures signal strength and displays a spectrum and signal strength bar for interference hunting and signal quality evaluations. |
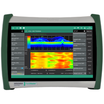
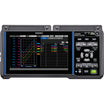
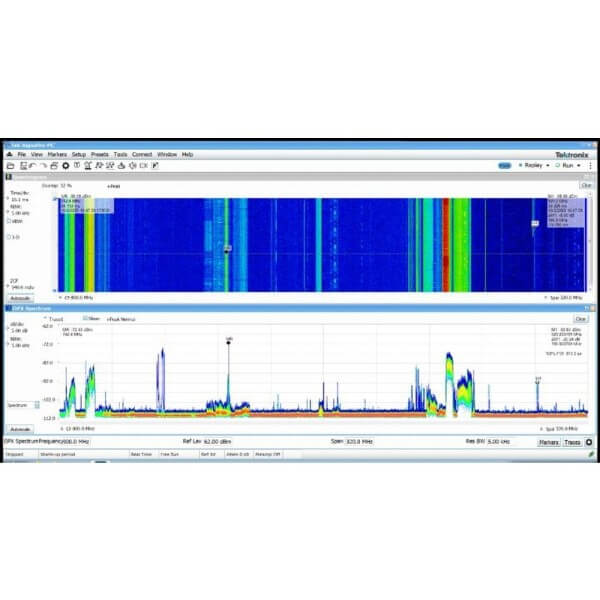
The illustration below demonstrates the power of wide-band continuous monitoring for determining spectrum occupancy and interference over time. The spectrogram and real-time spectrum displays off-air spectral activity over time from 640 MHz to 960 MHz, showing TV, narrow-band communications, cellular base stations and the unregulated 900 MHz ISM band, all time-correlated. The resolution bandwidth of the analysis is 25 kHz to assure a low noise floor, and the minimum signal duration for 100% probability of intercept is a remarkable 98 microseconds.

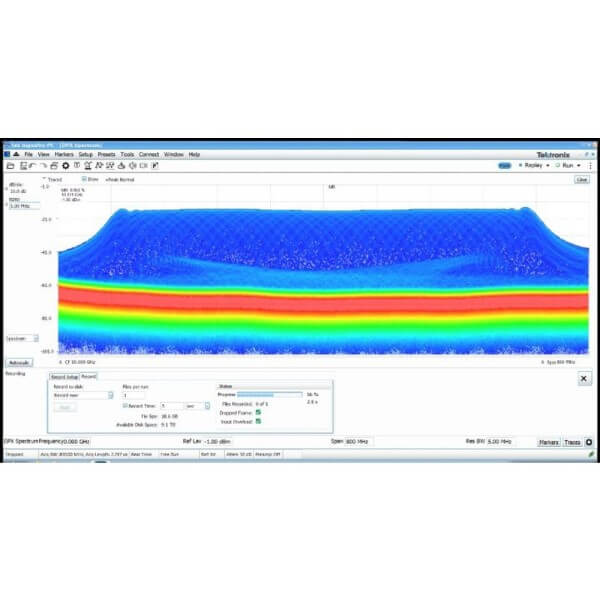
The RSA7100A combined with SignalVu-PC application licenses offers advanced analysis, 800 MHz bandwidth, streaming to internal RAID, and simultaneous streaming to multiple interfaces for record and playback
SignalVu-PC offers a wealth of application-oriented options, including:- Pulse analysis including exclusive Pulse-Ogram™ displays
- General-purpose modulation analysis (27 modulation types including 16/32/64/128/256 QAM, QPSK, O-QPSK, GMSK, FSK, APSK)
- EMC/EMI analysis with CISPR peak, quasi-peak, and average detectors
- Streaming data to internal RAID
- IQFlowTM provides simultaneous, continuous streaming of IQ data from the device to one or more clients through API and 40 GbE
- WLAN analysis of 802.11a/b/g/j/p, 802.11n, 802.11ac
- P25 analysis of phase I and phase 2 signals
- LTE™ FDD and TDD Base Station (eNB) Cell ID & RF measurements
- Bluetooth® analysis of Basic Rate, Low Energy, and Bluetooth 5. Some support of Enhanced Data Rate
- Mapping
- AM/FM/PM/Direct Audio Measurement including SINAD, THD
- Signal Classification and Survey
- Automated phase noise / jitter measurements
See the separate SignalVu-PC data sheet for complete details and ordering information. Selected applications are illustrated below.
Pulse analysis
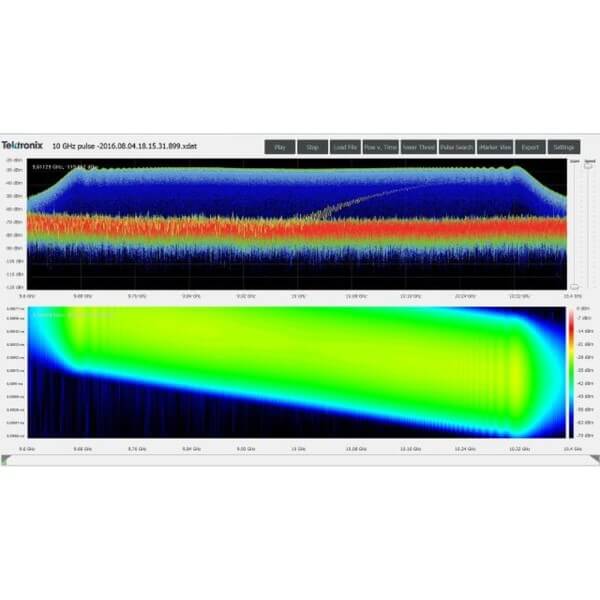
The Pulse Analysis package (SVPH) provides 29 individual measurements plus cumulative statistics, opening a world of characterization for wideband pulsed system designers and evaluators. The fast-frame acquisition mode of SignalVu-PC with the RSA7100A allows you to acquire just the time of interest during your pulse, making the most efficient use of memory. Cumulative statistics displays analyze data over multiple acquisitions, further extending the analysis to millions of pulses. Displays and measurements include:| Displays | Available measurements |
|---|---|
| Cumulative histograms of any measurement Cumulative measurements table with statistics (min, max, mean, standard deviation) Cumulative histograms of any measurement Pulse-Ogram waterfall display of amplitude vs. time of multiple pulses Spectrum of any pulse from the Pulse-Ogram Measurement display of any selected pulse vs. time Trend of selected measurement vs. pulse number FFT of selected measurement vs. pulse number | Pulse frequency Power (Average on, Peak, Average transmitted) Pulse width Rise time Fall time Repetition interval (seconds and Hz) Duty factor (% and ratio) Ripple (dB and %) Droop (dB and %) Overshoot (dB and %) Pulse-to-Pulse and Pulse-to-Reference frequency difference Pulse-to-Pulse and Pulse-to-Reference phase difference Frequency error (RMS and Maximum) Phase error (RMS and Maximum) Deviation (Frequency and Phase) Impulse response (dB and time) Time stamp |
For more information: Tektronix
Documents
Tektronix RSA7100A Real Time Analyzer
Tektronix RSA7100A DatasheetOptions
Tektronix RSA7100A Real Time Analyzer
Ordering information
RSA7100A
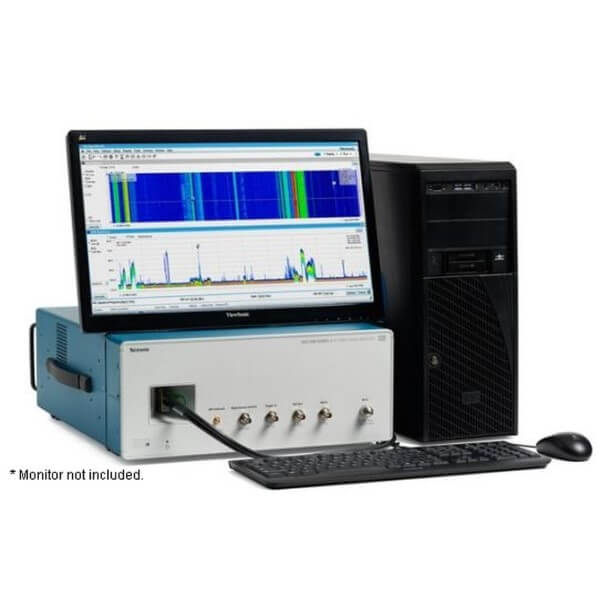
Real-Time Spectrum Analyzer, up to 800 MHz acquisition bandwidth Includes: Installation and safety manual, 3.5mm Crown Connector-Female, PCIe cable, mouse, keyboard, adapter: Mini-Display Port to HDMI, Mini-Display Port to DVI. Power cables, rack mount kits for acquisition unit and controller. Controller rack-mount is a 'telecom-style'. A server-style rackmount can also be used with the controller, available from third parties. Note: A PC monitor is not included with the RSA7100A. Tektronix recommends the Dell UltraSharp U2414H 23.8 inch Widescreen IPS LCD Monitor, or any monitor that supports Display port, DVI or HDMI input and has a minimum 1920 x 1080 display resolution.How to order
When ordering the RSA7100A, you select between two frequency ranges and whether you would like to have an internal GPS receiver and/or an ISO17025 calibration data report. SignalVu-PC licenses can be ordered as options to the RSA7100A and are installed on the unit during manufacturing, minimizing order complexity and saving you time in configuration upon receiving your instrument. These licenses are node-locked to the RSA7100A controller and can be moved twice over the lifetime of the license. All licenses, including floating licenses, can be ordered separately if greater flexibility is needed.RSA7100A license options
| RSA7100A and options | Description | Ordering instructions |
|---|---|---|
| RSA7100A | Real-time spectrum analyzer, 320 MHz bandwidth | |
| Opt. 14 | Frequency range 16 kHz-14 GHz | Select one |
| Opt. 26 | Frequency range 16 kHz-26.5 GHz | |
| Opt. GPS | GPS receiver | Select one |
| Opt. NO GPS | No GPS receiver | |
| Opt. CAL | Calibration report with data (ISO 17025) | |
| Opt. GPS CAL | GPS receiver and calibration report with data (ISO17025) | |
| Opt. C7100-A | Controller, no RAID storage | Select one |
| Opt. C7100-B | Controller, RAID storage, 20 minutes recording time at 800 MHz bandwidth (requires STREAMNL-SVPC) | |
| Opt. C7100-C | Controller, RAID storage, > 120 minutes recording time at 800 MHz bandwidth (requires STREAMNL-SVPC) | |
| Opt. SV09 | High performance real time (export class 3A002), node-locked license | Mandatory option |
| SignalVu-PC licenses ordered as options to CTRL7100A (Factory installed on unit) | License type | Description |
|---|---|---|
| Opt. B800NL-SVPC | Node locked | 800 MHz acquisition bandwidth |
| Opt. STREAMNL-SVPC | Node locked | Steaming data |
| Opt. SVMHNL-SVPC | Node locked | General Purpose Modulation Analysis to work with analyzer of any acquisition bandwidth and MDO |
| Opt. SVPHNL-SVPC | Node locked | Pulse Analysis to work with analyzer of any acquisition bandwidth and MDO |
| Opt. TRIGHNL-SVPC | Node locked | Advanced triggers (Frequency Mask, Density) to work with RSA7100A |
| Opt. MAPNL-SVPC | Node locked | Mapping and signal strength |
| Opt. SV54NL-SVPC | Node locked | Signal survey and classification |
| Opt. SVTNL-SVPC | Node locked | Settling Time (frequency and phase) measurements |
| Opt. SV23NL-SVPC | Node locked | WLAN 802.11a/b/g/j/p measurement |
| Opt. SV24NL-SVPC | Node locked | WLAN 802.11n measurement (requires SV23) |
| Opt. SV25HNL-SVPC | Node locked | WLAN 802.11ac measurement to work with analyzer of acquisition bandwidth ≤40 MHz and MDO4000B/C (requires SV23 and SV24) |
| Opt. SV26NL-SVPC | Node locked | APCO P25 measurement |
| Opt. SV27NL-SVPC | Node locked | Bluetooth measurement to work with analyzer of acquisition bandwidth ≤40 MHz and MDO4000B/C |
| Opt. SV28NL-SVPC | Node locked | LTE Downlink RF measurement to work with analyzer of acquisition bandwidth ≤40 MHz and MDO4000B/C |
| Opt. SVANL-SVPC | Node locked | AM/FM/PM/Direct Audio Analysis |
| Opt. SVONL-SVPC | Node locked | Flexible OFDM Analysis |
| Opt. CONNL-SVPC | Node locked | SignalVu-PC live link to the MDO4000B/C series mixed-domain oscilloscopes |
Service options
- Opt. G3
- Complete Care 3 Years (includes loaner, scheduled calibration, and more)
- Opt. G5
- Complete Care 5 Years (includes loaner, scheduled calibration, and more)
Complimentary products
DataVu-PC is recommended for users who record data using the RSA7100A streaming and RAID options. Ordering information for DataVu-PC is shown below. See the separate DataVu-PC datasheet for details on licensing, minimum PC requirements, features, and functions.DataVu-PC ordering information
DataVu-PC is distributed via www.tek.com. Hard copy versions of the software are not available. An operation manual is distributed in .pdf format with the software.| Nomenclature | License type | Description |
|---|---|---|
| DVPC-SPAN50NL | Node locked | Base version, DataVu-PC operation on acquisitions to 50 MHz bandwidth |
| DVPC-SPAN50FL | Floating | |
| DVPC-SPAN200NL 1 | Node locked | Base version, DataVu-PC operation on acquisitions to 200 MHz bandwidth |
| DVPC-SPAN200FL | Floating | |
| DVPC-SPAN1000NL | Node locked | Base version, DataVu-PC operation on acquisitions to 1000 MHz bandwidth |
| DVPC-SPAN1000FL | Floating | |
| DVPC-SMARKNL | Node locked | DataVu-PC smart markers and time overview (requires base version) |
| DVPC-SMARKFL | Floating | |
| DVPC-PULSENL | Node locked | DataVu-PC pulse analysis (requires DVPC-SMARKNL) |
| DVPC-PULSEFL | Floating |
1DataVu-PC can open files recorded in 16-bit .XDAT format from any source. If you have a data source that records at 50 MHz to 200 MHz bandwidth, such as a Tektronix RSA5000 or RSA6000 series spectrum analyzer with a third-party recording solution, choose DVPC-SPAN200.
CTRL7100A: Additional controllers for the RSA7100A
Additional controllers are available for the RSA7100A should you need to have controllers in multiple locations. The CTRL7100A is identical to the unit included with the RSA7100A. For detailed ordering information, see the CTRL7100A datasheet on www.Tek.com.Video
Tektronix RSA7100A Real Time Analyzer
The Tektronix RSA7100A wideband signal analyzer offers real time spectrum analysis up to 800 MHz bandwidth, simultaneous streaming to multiple interfaces for record (up to 2 hours) and playback of seamless data at full bandwidth.The RSA7100A gives you the power to imagine new solutions
The RSA7100A is a high performance spectrum analyzer focused on wideband analysis and signal recording. By separating the RF acquisitions from the compute engine, a graphics processor can be used in place of previously required FPGA designs for real time processing. As processor capabilities advance, new performance can be easily maintained for the system with PC upgrades instead of RF hardware replacement, making the RSA7100A a smart choice for minimizing long term costs. You can also harness the power of this CPU/GPU combination in your own simulations and designs, using the instrument as a powerful workstation.The RSA7100A is designed for engineers working on the latest wideband designs in communications, radar and electronic warfare and for spectrum managers who need to see the effects of new wideband systems when fielded and operational.
Analysis of signals is enabled with two software packages. SignalVu-PC for real time, spectrum and vector signal analysis, and DataVu-PC for analysis of the very large file sets produced when recording wideband signals.
SignalVu-PC software offers rich analysis capability
The RSA7100 operates with SignalVu-PC, a powerful program used as the basis of Tek's traditional spectrum analyzers. SignalVu-PC offers a deep analysis capability including real time spectrum analysis and a wide variety of application packages. Real-time processing of the DPX® spectrum/spectrogram is enabled in your PC, further reducing the cost of hardware. A programmatic interface to SignalVu-PC is provided, offering all measurements and settings to external programs. Basic functionality of the free SignalVu-PC program is far from basic and includes the measurements shown below.| Measurements and functions included in SignalVu-PC base version | |
| General signal analysis | Description |
| Spectrum analyzer | Spans from 100 Hz to full range of the instrument, 3 traces + math and spectrogram trace, 5 markers with power, relative power, integrated power, power density and dBc/Hz functions |
| DPX spectrum/spectrogram | Real time display of spectrum with 100% probability of intercept of up to 419 nsec signals in up to 800 MHz span |
| Amplitude, frequency, phase vs. time, RF I and Q vs. time | Basic vector analysis functions |
| Time Overview/Navigator | Enables easy setting of acquisition and analysis times for deep analysis in multiple domains |
| Spectrogram | Analyze and re-analyze your signal in 2-D or 3-D waterfall display |
| Analog modulation analysis | Description |
| AM, FM, PM analysis | Measures key AM, FM, PM parameters |
| RF measurements | Description |
| Spurious measurement | User-defined limit lines and regions provide automatic spectrum violation testing across the entire range of the instrument. |
| Spectrum emission mask | User-set or standards-specific masks. |
| Occupied bandwidth | Measures 99% power, -xdB down points. |
| Channel power and ACLR | Variable channel and adjacent/alternate channel parameters. |
| MCPR | Sophisticated, flexible multi-channel power measurements. |
| CCDF | Complementary Cumulative Distribution Function plots the statistical variations in signal level. |
| Signal strength | Measures signal strength and displays a spectrum and signal strength bar for interference hunting and signal quality evaluations. |
The illustration below demonstrates the power of wide-band continuous monitoring for determining spectrum occupancy and interference over time. The spectrogram and real-time spectrum displays off-air spectral activity over time from 640 MHz to 960 MHz, showing TV, narrow-band communications, cellular base stations and the unregulated 900 MHz ISM band, all time-correlated. The resolution bandwidth of the analysis is 25 kHz to assure a low noise floor, and the minimum signal duration for 100% probability of intercept is a remarkable 98 microseconds.
The RSA7100A combined with SignalVu-PC application licenses offers advanced analysis, 800 MHz bandwidth, streaming to internal RAID, and simultaneous streaming to multiple interfaces for record and playback
SignalVu-PC offers a wealth of application-oriented options, including:- Pulse analysis including exclusive Pulse-Ogram™ displays
- General-purpose modulation analysis (27 modulation types including 16/32/64/128/256 QAM, QPSK, O-QPSK, GMSK, FSK, APSK)
- EMC/EMI analysis with CISPR peak, quasi-peak, and average detectors
- Streaming data to internal RAID
- IQFlowTM provides simultaneous, continuous streaming of IQ data from the device to one or more clients through API and 40 GbE
- WLAN analysis of 802.11a/b/g/j/p, 802.11n, 802.11ac
- P25 analysis of phase I and phase 2 signals
- LTE™ FDD and TDD Base Station (eNB) Cell ID & RF measurements
- Bluetooth® analysis of Basic Rate, Low Energy, and Bluetooth 5. Some support of Enhanced Data Rate
- Mapping
- AM/FM/PM/Direct Audio Measurement including SINAD, THD
- Signal Classification and Survey
- Automated phase noise / jitter measurements
See the separate SignalVu-PC data sheet for complete details and ordering information. Selected applications are illustrated below.
Pulse analysis
The Pulse Analysis package (SVPH) provides 29 individual measurements plus cumulative statistics, opening a world of characterization for wideband pulsed system designers and evaluators. The fast-frame acquisition mode of SignalVu-PC with the RSA7100A allows you to acquire just the time of interest during your pulse, making the most efficient use of memory. Cumulative statistics displays analyze data over multiple acquisitions, further extending the analysis to millions of pulses. Displays and measurements include:| Displays | Available measurements |
|---|---|
| Cumulative histograms of any measurement Cumulative measurements table with statistics (min, max, mean, standard deviation) Cumulative histograms of any measurement Pulse-Ogram waterfall display of amplitude vs. time of multiple pulses Spectrum of any pulse from the Pulse-Ogram Measurement display of any selected pulse vs. time Trend of selected measurement vs. pulse number FFT of selected measurement vs. pulse number | Pulse frequency Power (Average on, Peak, Average transmitted) Pulse width Rise time Fall time Repetition interval (seconds and Hz) Duty factor (% and ratio) Ripple (dB and %) Droop (dB and %) Overshoot (dB and %) Pulse-to-Pulse and Pulse-to-Reference frequency difference Pulse-to-Pulse and Pulse-to-Reference phase difference Frequency error (RMS and Maximum) Phase error (RMS and Maximum) Deviation (Frequency and Phase) Impulse response (dB and time) Time stamp |
For more information: Tektronix
Tektronix RSA7100A Real Time Analyzer
Tektronix RSA7100A DatasheetTektronix RSA7100A Real Time Analyzer
Ordering information
RSA7100A
Real-Time Spectrum Analyzer, up to 800 MHz acquisition bandwidth Includes: Installation and safety manual, 3.5mm Crown Connector-Female, PCIe cable, mouse, keyboard, adapter: Mini-Display Port to HDMI, Mini-Display Port to DVI. Power cables, rack mount kits for acquisition unit and controller. Controller rack-mount is a 'telecom-style'. A server-style rackmount can also be used with the controller, available from third parties. Note: A PC monitor is not included with the RSA7100A. Tektronix recommends the Dell UltraSharp U2414H 23.8 inch Widescreen IPS LCD Monitor, or any monitor that supports Display port, DVI or HDMI input and has a minimum 1920 x 1080 display resolution.How to order
When ordering the RSA7100A, you select between two frequency ranges and whether you would like to have an internal GPS receiver and/or an ISO17025 calibration data report. SignalVu-PC licenses can be ordered as options to the RSA7100A and are installed on the unit during manufacturing, minimizing order complexity and saving you time in configuration upon receiving your instrument. These licenses are node-locked to the RSA7100A controller and can be moved twice over the lifetime of the license. All licenses, including floating licenses, can be ordered separately if greater flexibility is needed.RSA7100A license options
| RSA7100A and options | Description | Ordering instructions |
|---|---|---|
| RSA7100A | Real-time spectrum analyzer, 320 MHz bandwidth | |
| Opt. 14 | Frequency range 16 kHz-14 GHz | Select one |
| Opt. 26 | Frequency range 16 kHz-26.5 GHz | |
| Opt. GPS | GPS receiver | Select one |
| Opt. NO GPS | No GPS receiver | |
| Opt. CAL | Calibration report with data (ISO 17025) | |
| Opt. GPS CAL | GPS receiver and calibration report with data (ISO17025) | |
| Opt. C7100-A | Controller, no RAID storage | Select one |
| Opt. C7100-B | Controller, RAID storage, 20 minutes recording time at 800 MHz bandwidth (requires STREAMNL-SVPC) | |
| Opt. C7100-C | Controller, RAID storage, > 120 minutes recording time at 800 MHz bandwidth (requires STREAMNL-SVPC) | |
| Opt. SV09 | High performance real time (export class 3A002), node-locked license | Mandatory option |
| SignalVu-PC licenses ordered as options to CTRL7100A (Factory installed on unit) | License type | Description |
|---|---|---|
| Opt. B800NL-SVPC | Node locked | 800 MHz acquisition bandwidth |
| Opt. STREAMNL-SVPC | Node locked | Steaming data |
| Opt. SVMHNL-SVPC | Node locked | General Purpose Modulation Analysis to work with analyzer of any acquisition bandwidth and MDO |
| Opt. SVPHNL-SVPC | Node locked | Pulse Analysis to work with analyzer of any acquisition bandwidth and MDO |
| Opt. TRIGHNL-SVPC | Node locked | Advanced triggers (Frequency Mask, Density) to work with RSA7100A |
| Opt. MAPNL-SVPC | Node locked | Mapping and signal strength |
| Opt. SV54NL-SVPC | Node locked | Signal survey and classification |
| Opt. SVTNL-SVPC | Node locked | Settling Time (frequency and phase) measurements |
| Opt. SV23NL-SVPC | Node locked | WLAN 802.11a/b/g/j/p measurement |
| Opt. SV24NL-SVPC | Node locked | WLAN 802.11n measurement (requires SV23) |
| Opt. SV25HNL-SVPC | Node locked | WLAN 802.11ac measurement to work with analyzer of acquisition bandwidth ≤40 MHz and MDO4000B/C (requires SV23 and SV24) |
| Opt. SV26NL-SVPC | Node locked | APCO P25 measurement |
| Opt. SV27NL-SVPC | Node locked | Bluetooth measurement to work with analyzer of acquisition bandwidth ≤40 MHz and MDO4000B/C |
| Opt. SV28NL-SVPC | Node locked | LTE Downlink RF measurement to work with analyzer of acquisition bandwidth ≤40 MHz and MDO4000B/C |
| Opt. SVANL-SVPC | Node locked | AM/FM/PM/Direct Audio Analysis |
| Opt. SVONL-SVPC | Node locked | Flexible OFDM Analysis |
| Opt. CONNL-SVPC | Node locked | SignalVu-PC live link to the MDO4000B/C series mixed-domain oscilloscopes |
Service options
- Opt. G3
- Complete Care 3 Years (includes loaner, scheduled calibration, and more)
- Opt. G5
- Complete Care 5 Years (includes loaner, scheduled calibration, and more)
Complimentary products
DataVu-PC is recommended for users who record data using the RSA7100A streaming and RAID options. Ordering information for DataVu-PC is shown below. See the separate DataVu-PC datasheet for details on licensing, minimum PC requirements, features, and functions.DataVu-PC ordering information
DataVu-PC is distributed via www.tek.com. Hard copy versions of the software are not available. An operation manual is distributed in .pdf format with the software.| Nomenclature | License type | Description |
|---|---|---|
| DVPC-SPAN50NL | Node locked | Base version, DataVu-PC operation on acquisitions to 50 MHz bandwidth |
| DVPC-SPAN50FL | Floating | |
| DVPC-SPAN200NL 1 | Node locked | Base version, DataVu-PC operation on acquisitions to 200 MHz bandwidth |
| DVPC-SPAN200FL | Floating | |
| DVPC-SPAN1000NL | Node locked | Base version, DataVu-PC operation on acquisitions to 1000 MHz bandwidth |
| DVPC-SPAN1000FL | Floating | |
| DVPC-SMARKNL | Node locked | DataVu-PC smart markers and time overview (requires base version) |
| DVPC-SMARKFL | Floating | |
| DVPC-PULSENL | Node locked | DataVu-PC pulse analysis (requires DVPC-SMARKNL) |
| DVPC-PULSEFL | Floating |
1DataVu-PC can open files recorded in 16-bit .XDAT format from any source. If you have a data source that records at 50 MHz to 200 MHz bandwidth, such as a Tektronix RSA5000 or RSA6000 series spectrum analyzer with a third-party recording solution, choose DVPC-SPAN200.